Red/Blue Team Lab Setup
Table of Contents
Introduction
This lab sets up a red/blue team environment to practice detection and response to threats. It includes installing and configuring Elasticsearch, Kibana, and Fleet Server, installing Sysmon and Elastic Agent on a Windows Server host, and integrating Windows event logs and Defender alerts into the system. The setup allows for centralized log collection, monitoring, and analysis through Kibana dashboards.
Lab Diagram
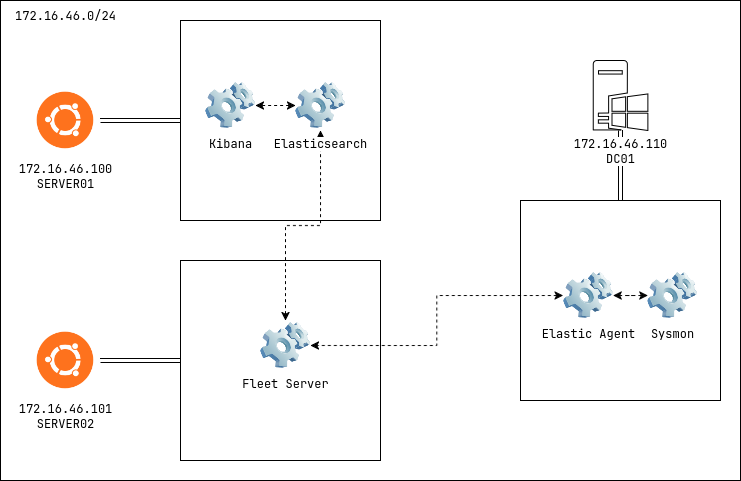
This diagram shows how our lab will look. We’ll use it as a plan for setting up the environment.
Elasticsearch and Kibana
Before installing Elasticsearch and Kibana, we need to assign a static IP address to our machine as shown in the lab diagram. This can be done by modifying the configuration file located at /etc/netplan/50-cloud-init.yaml.
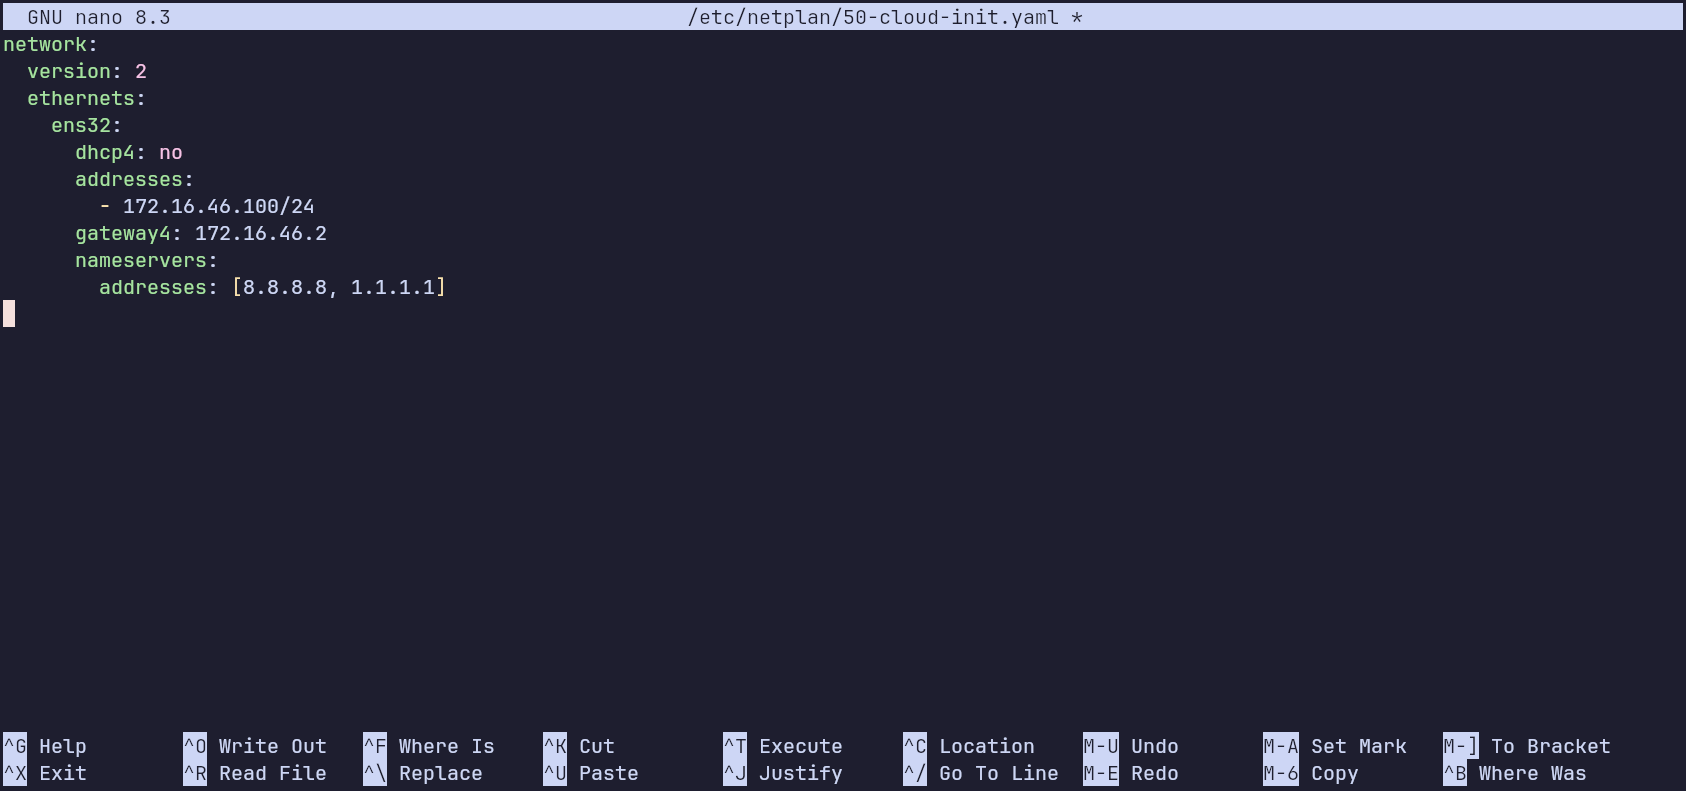
network:
  version: 2
  ethernets:
    ens32:
      dhcp4: no
      addresses:
        - 172.16.46.100/24
      gateway4: 172.16.46.2
      nameservers:
        addresses: [8.8.8.8, 1.1.1.1]
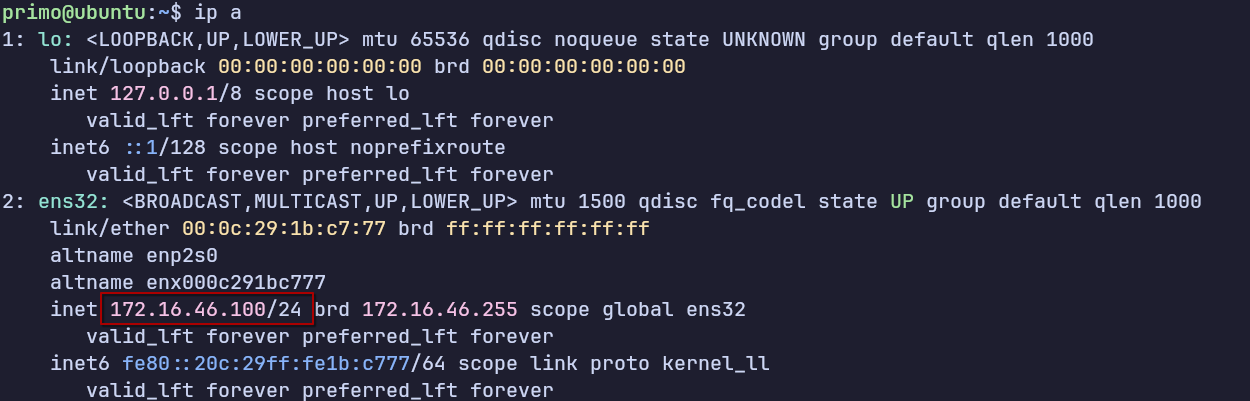
Save and close the file, then run the following command to apply the changes:
sudo netplan apply
Verify the static IP configuration by running:
Elasticsearch
In this lab, Elasticsearch will store Windows event logs and enable querying and searching through them.
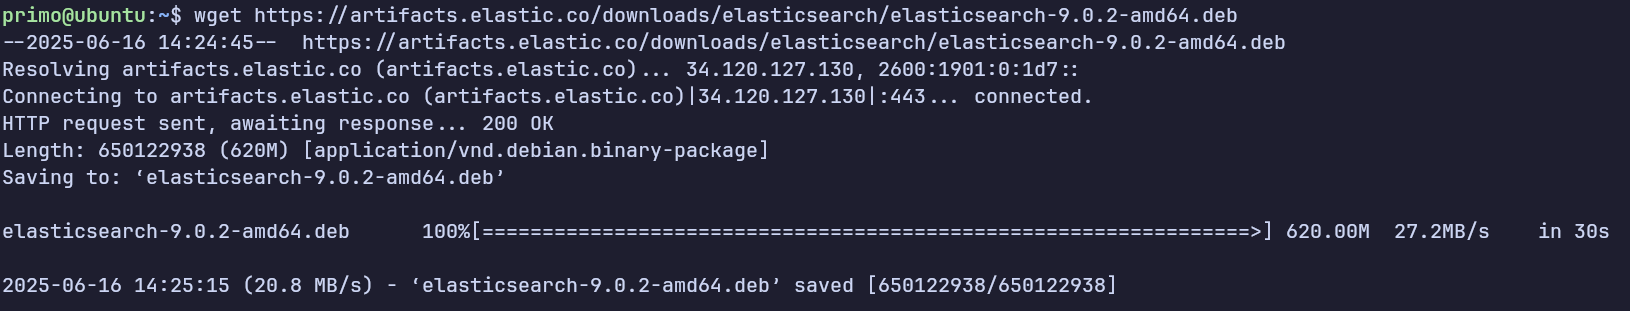
Download the Elasticsearch Debian package (.deb) from the official Elastic website here. Install it using:
sudo dpkg -i elasticsearch-9.0.2-amd64.deb
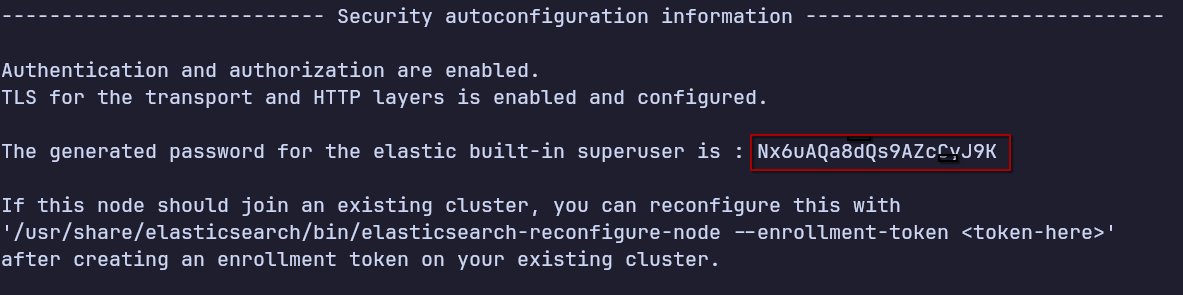
The installation process will display a superuser password. Save this password for authenticating to Elasticsearch authentication.
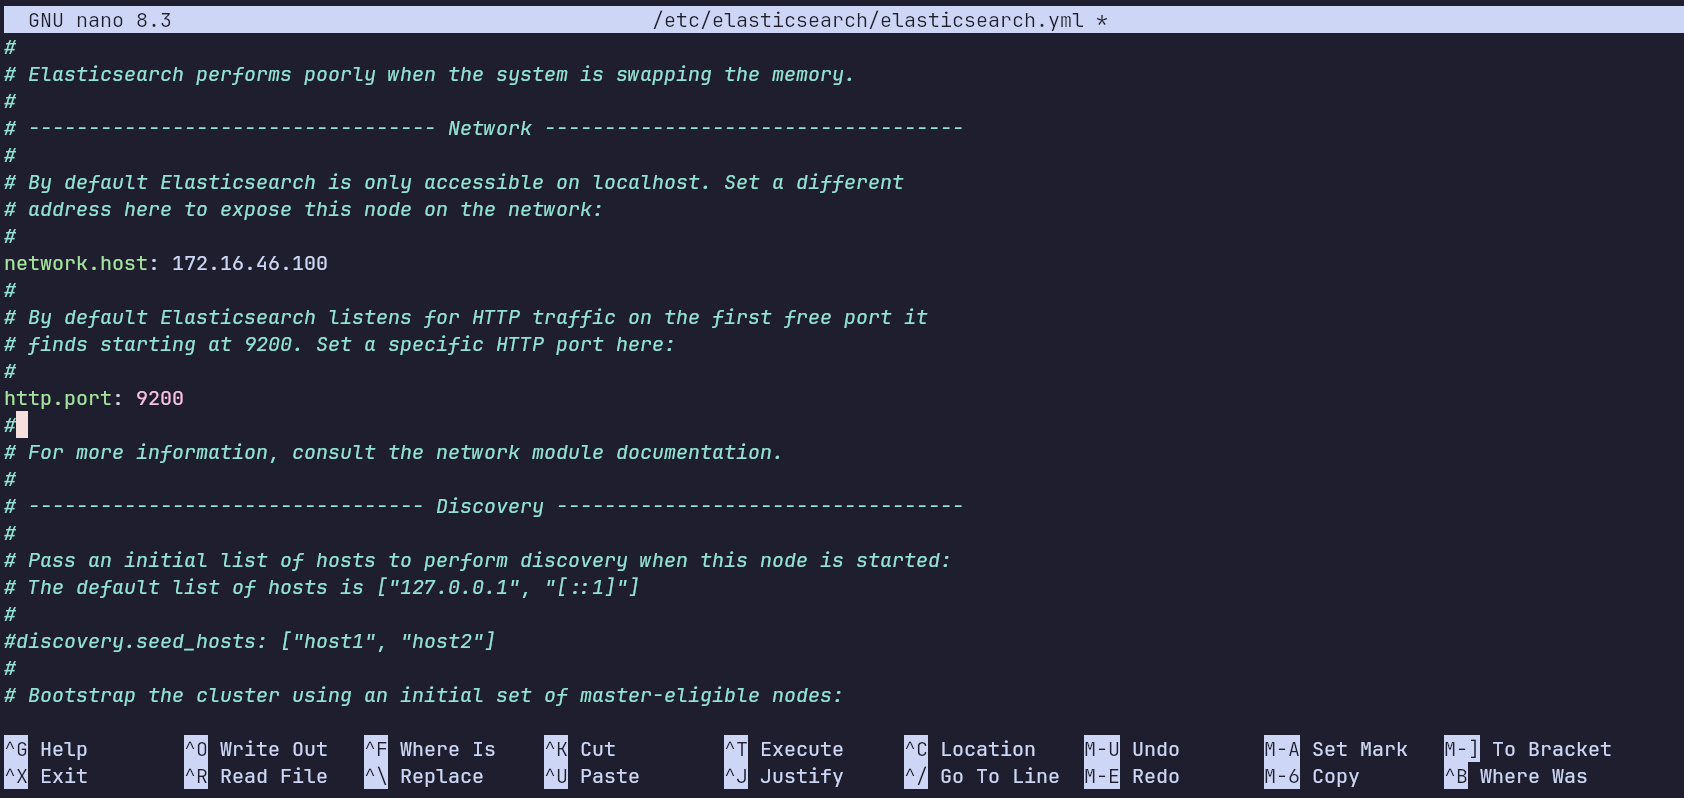
Before starting the Elasticsearch service, configure the host and port by editing /etc/elasticsearch/elasticsearch.yml. Set network.host to the server IP 172.16.46.100 and http.port to 9200.
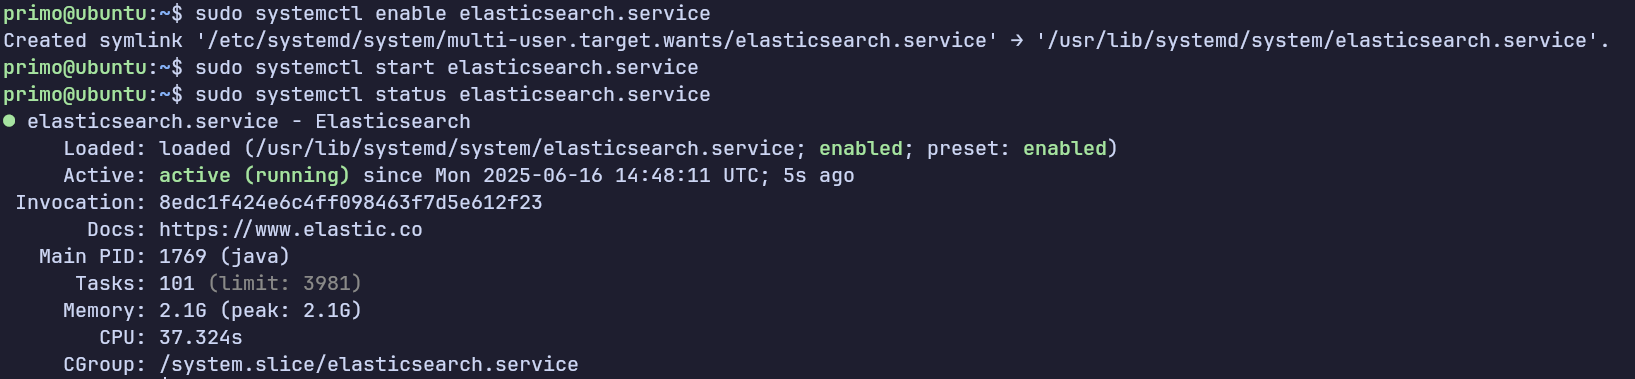
Start and enable the Elasticsearch service:
 sudo systemctl enable elasticsearch.service
 sudo systemctl start elasticsearch.service
Kibana
Download the Kibana Debian package (.deb) from the official Elastic website here.
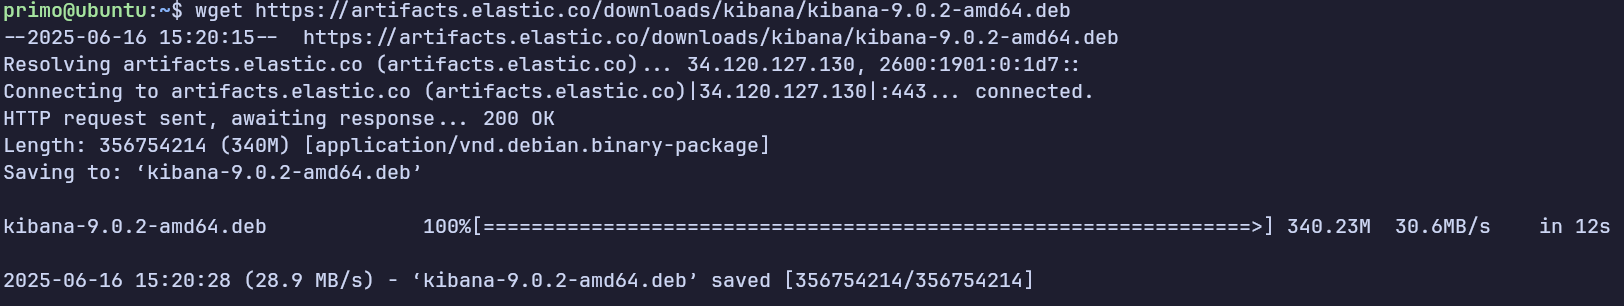
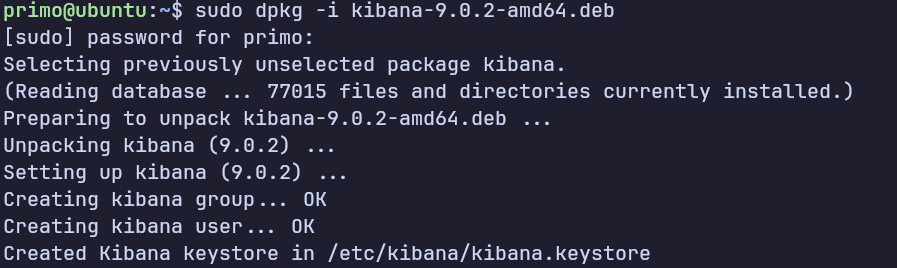
Install it using:
sudo dpkg -i kibana-9.0.2-amd64.deb
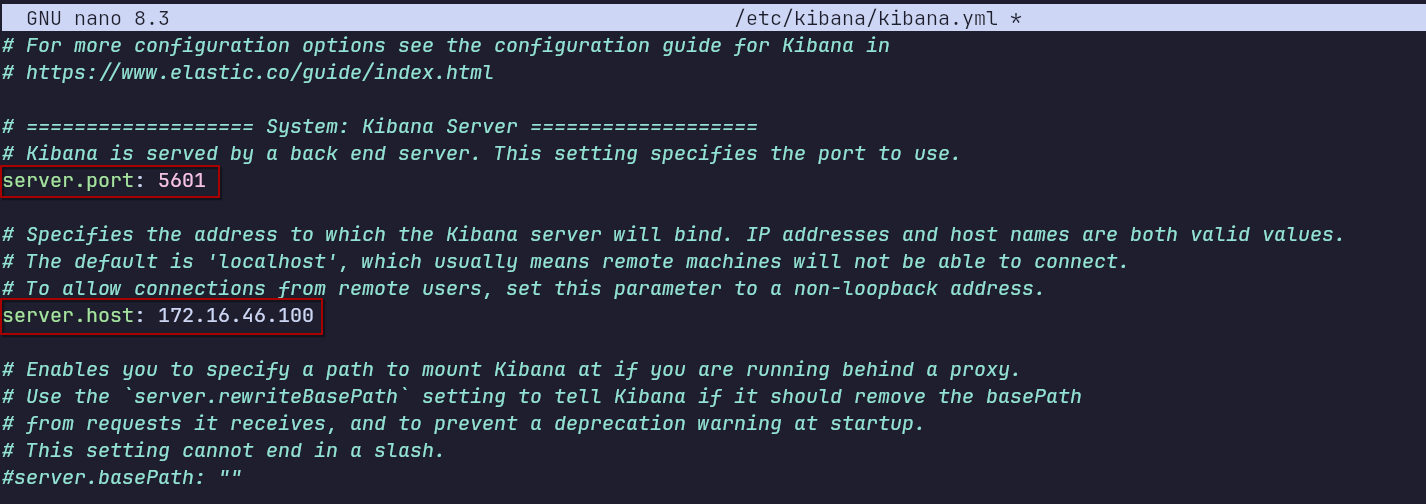
Configure Kibana by editing /etc/kibana/kibana.yml to set the host and port it will listen on.
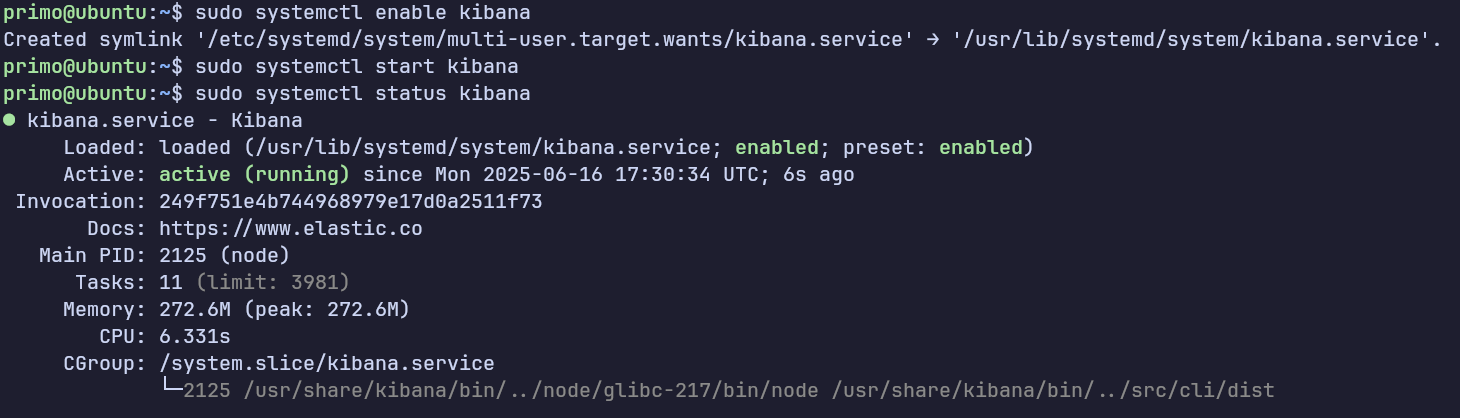
Enable and start the Kibana service:
sudo systemctl enable kibana
sudo systemctl start kibana
sudo systemctl status kibana // check service status
Assign hostnames to each virtual machine by editing the /etc/hosts file on the host machine. For Windows, edit C:\Windows\System32\drivers\etc\hosts.
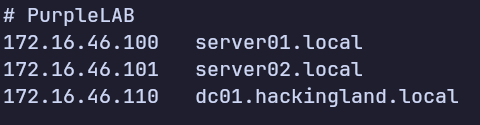
Access Kibana at http://server01.local:5601.
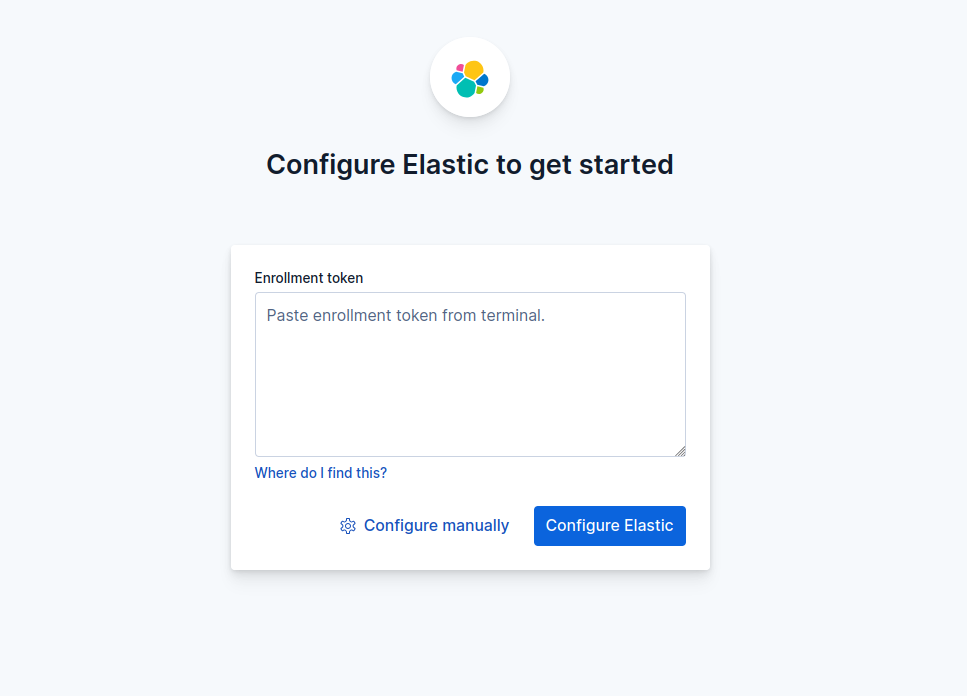
In order to make kibana work with elasticsearch we need to provide an enrollment token generated from elasticsearch.
we can generate this token with the binary located in /usr/share/elasticsearch/bin/elasticsearch-create-enrollment-token.
the following command will generate the enrollment token:
sudo /usr/share/elasticsearch/bin/elasticsearch-create-enrollment-token --scope kibana

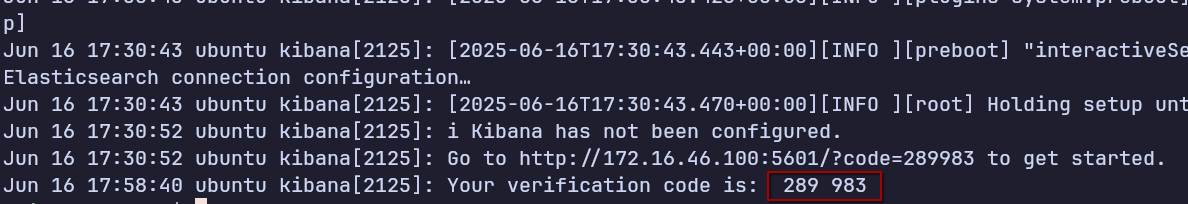
We’ll be asked to enter verification code you can get it from kibana service logs by running sudo systemctl status kibna.
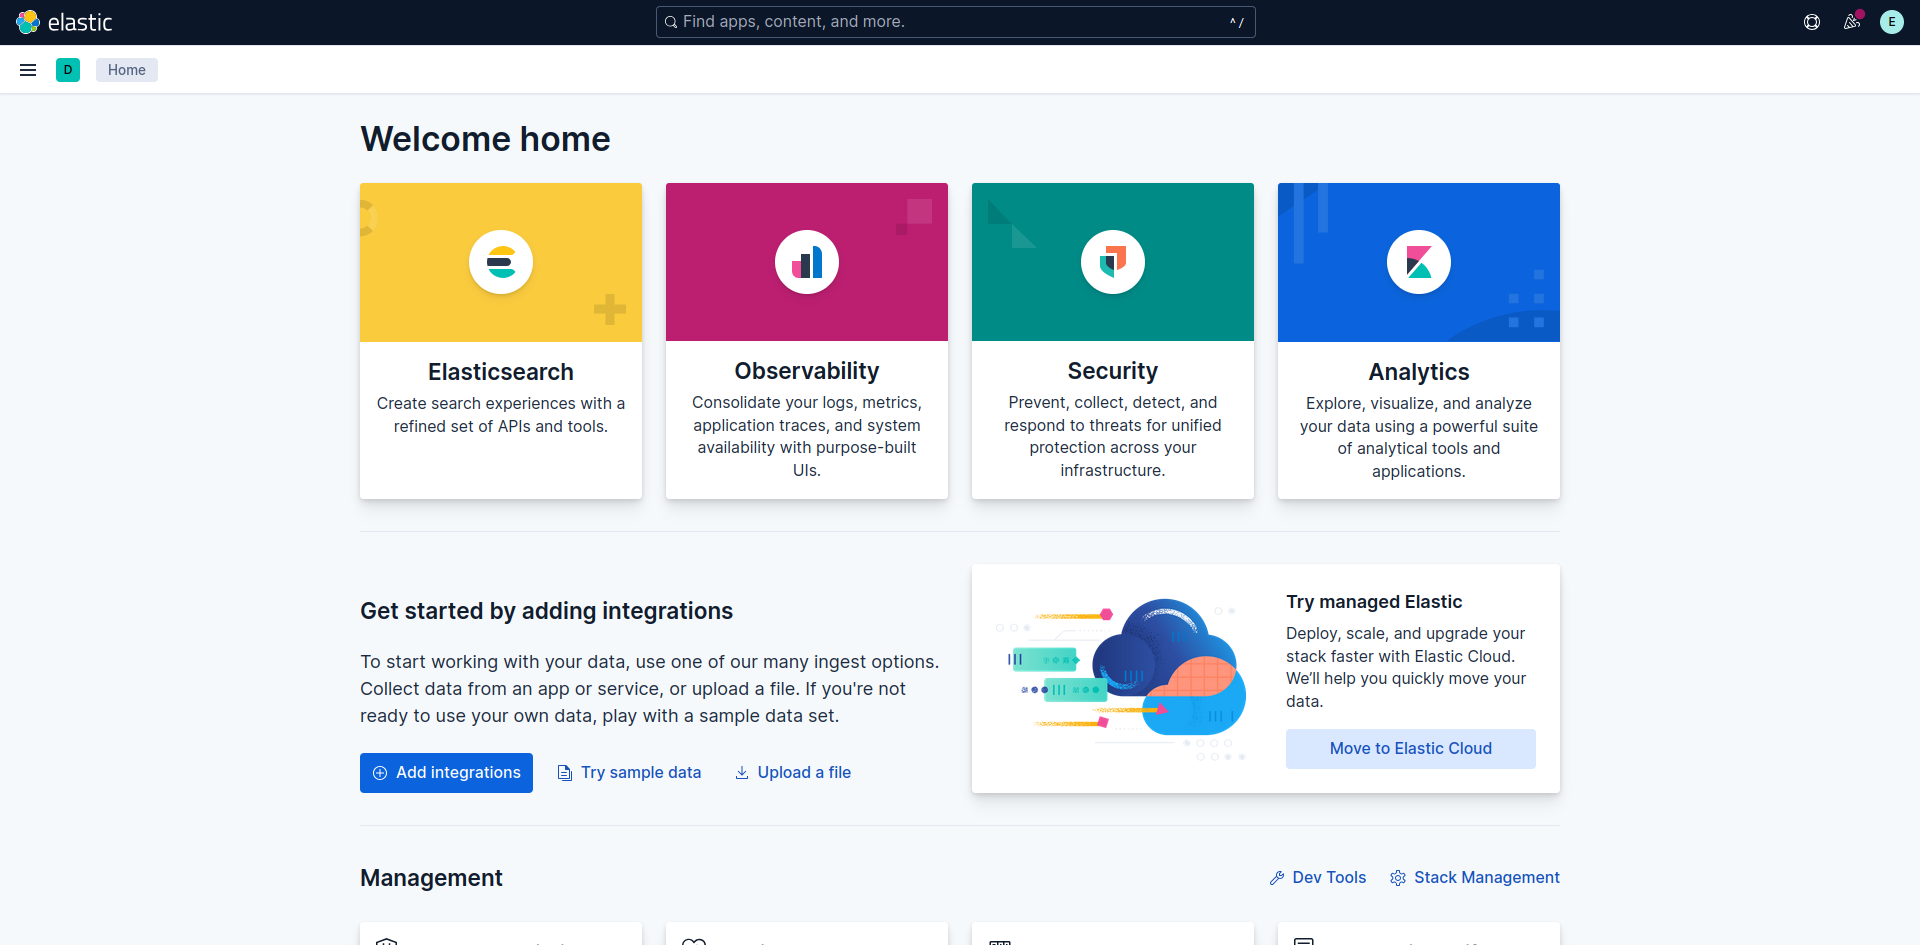
we can now login with our superuser account (elastic) and the password we saved while installing elasticsearch.
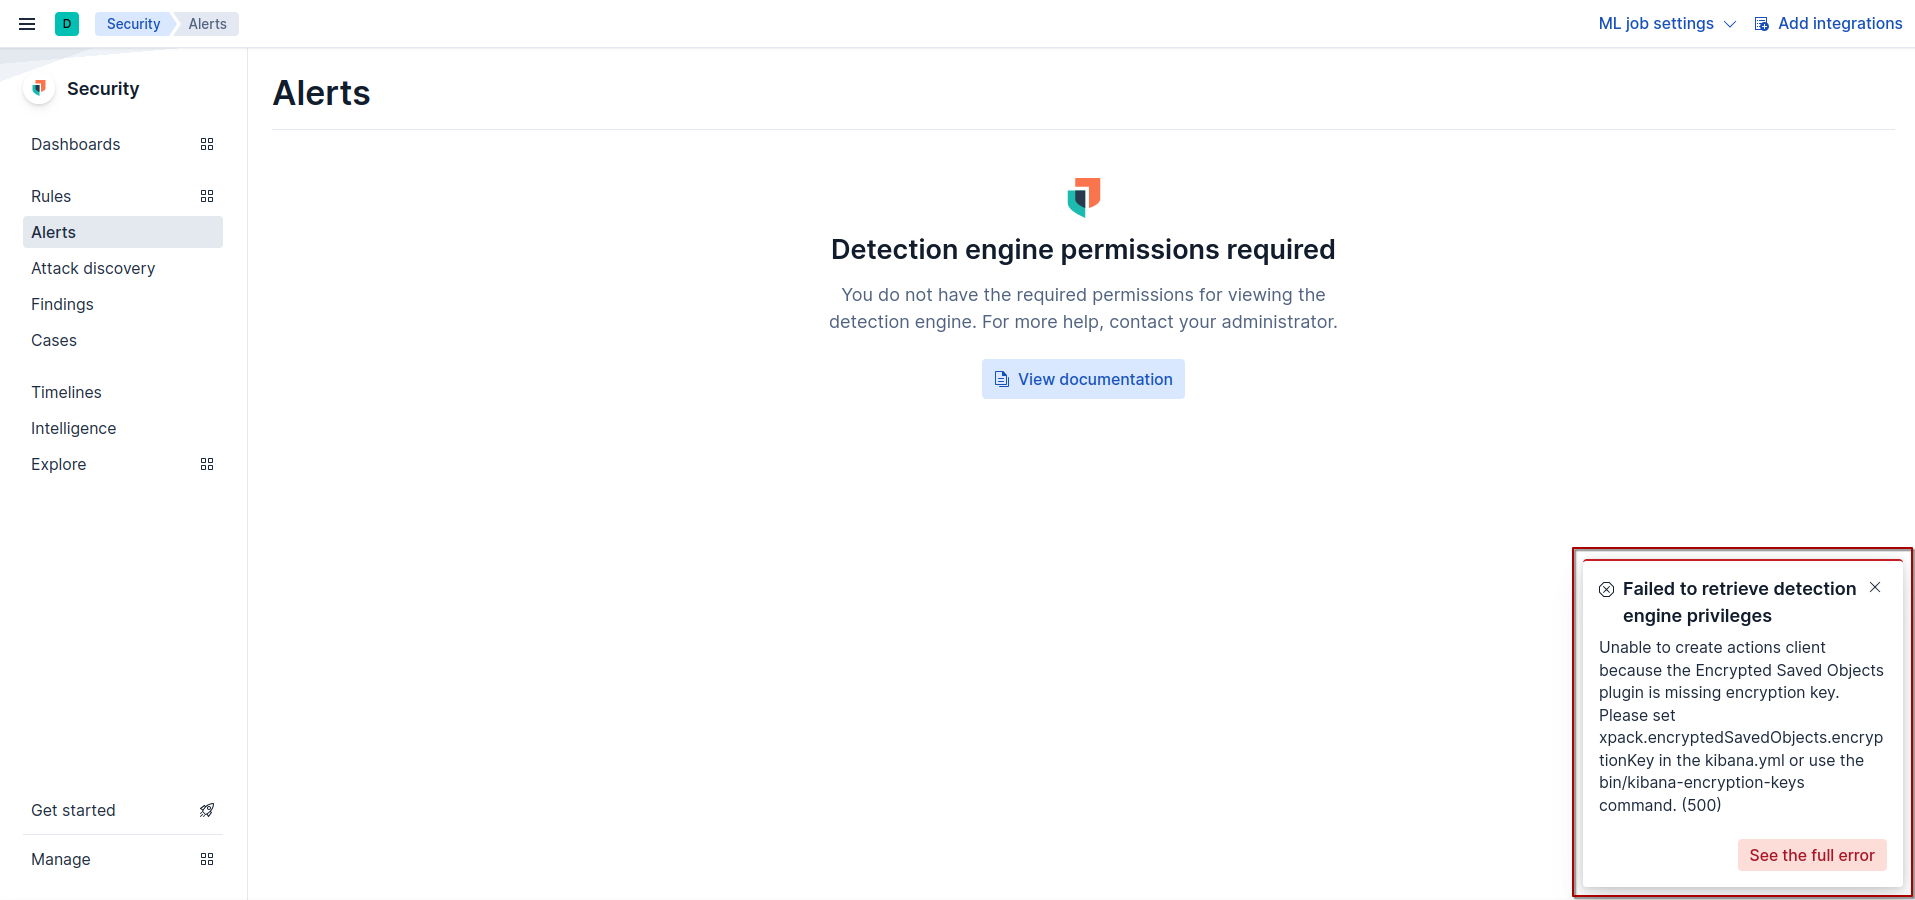
if you go to Security -> Alerts you will get the following error:
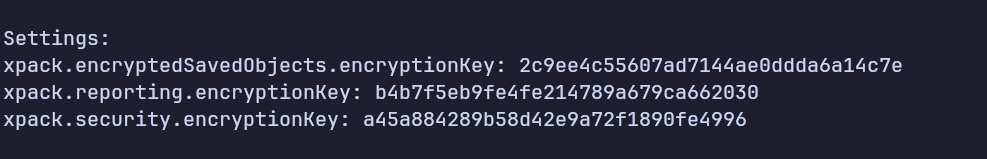
To fix this error we’ll need to generate keys for kibana to use. we can run /usr/share/kibana/bin/kibana-encryption-keys generate to generate those keys.
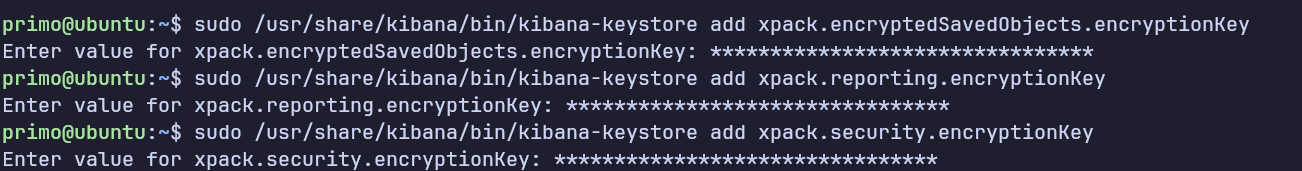
Now add them to kibana using the command /usr/share/kibana/bin/kibana-keystore add <name-of-the-key>.
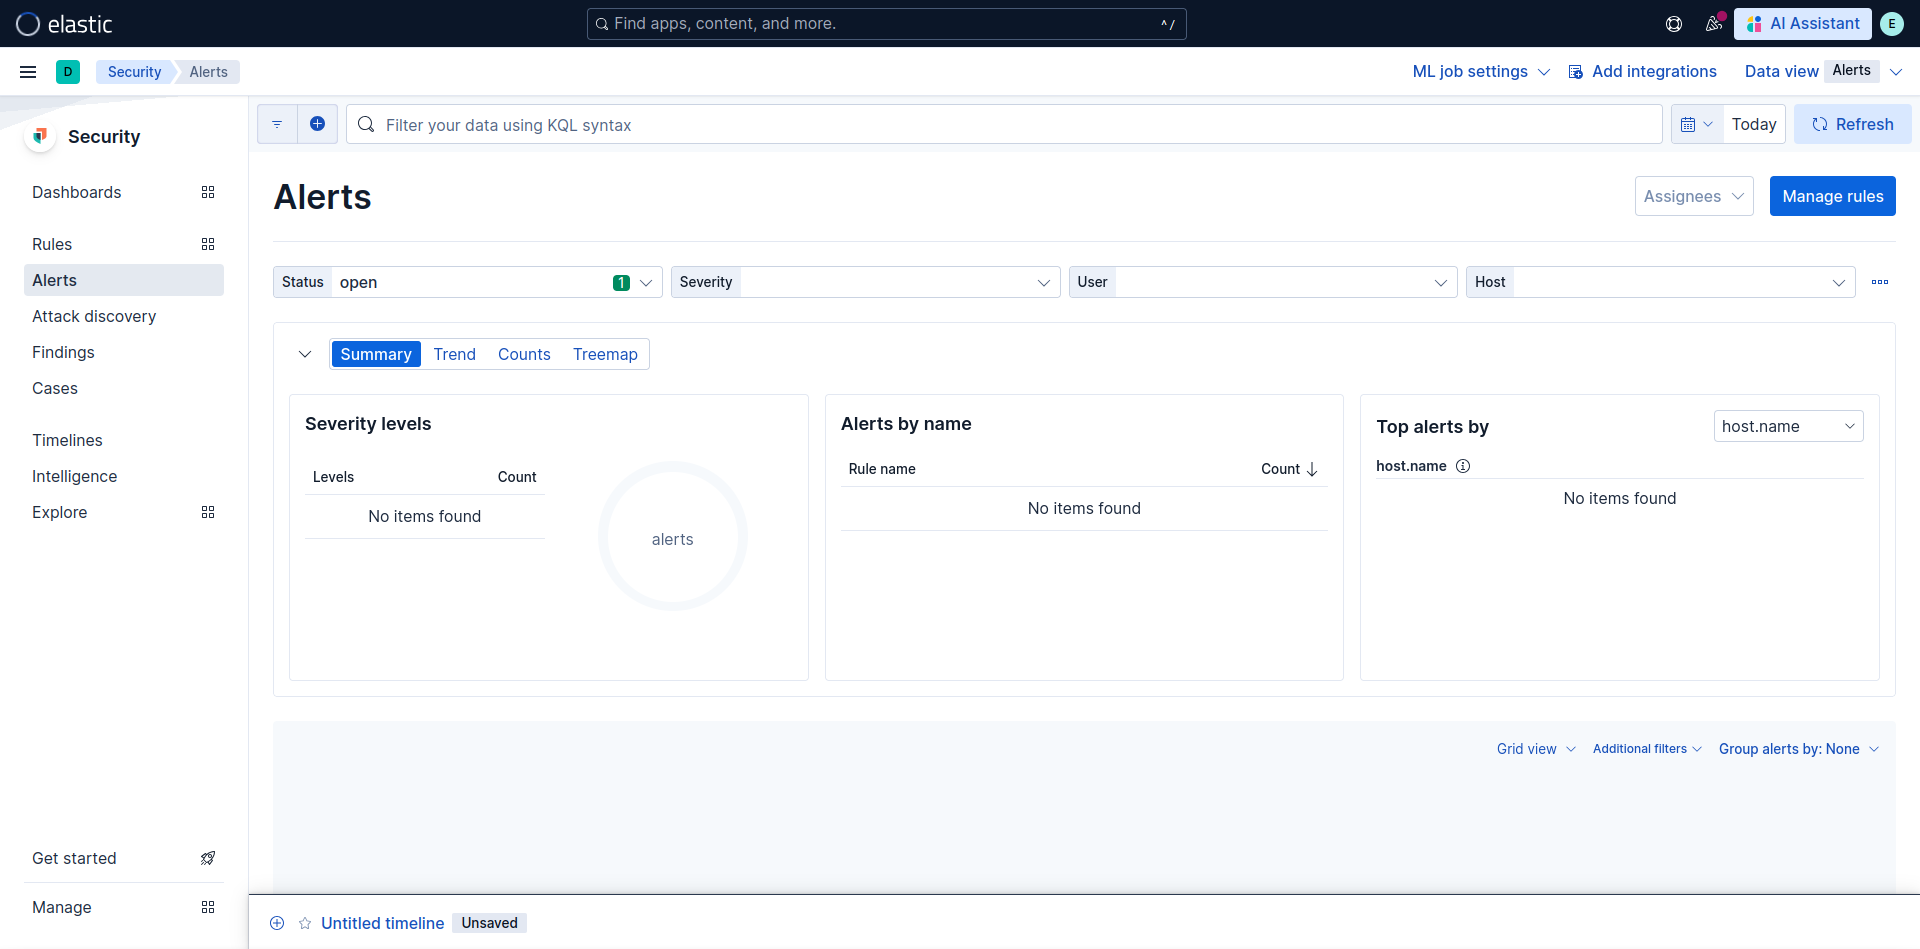
once the keys are set we need to restart kibana service with command sudo systemctl restart kibana. and no errors are shown.
Fleet server
Fleet server will allow us to manage multiple agents running on diffrent endpoints and apply or update policy to them. Fleet server will be running on a new ubuntu VM with the static ip shown in the lab setup diagram. the static ip can be assign following the previous steps.
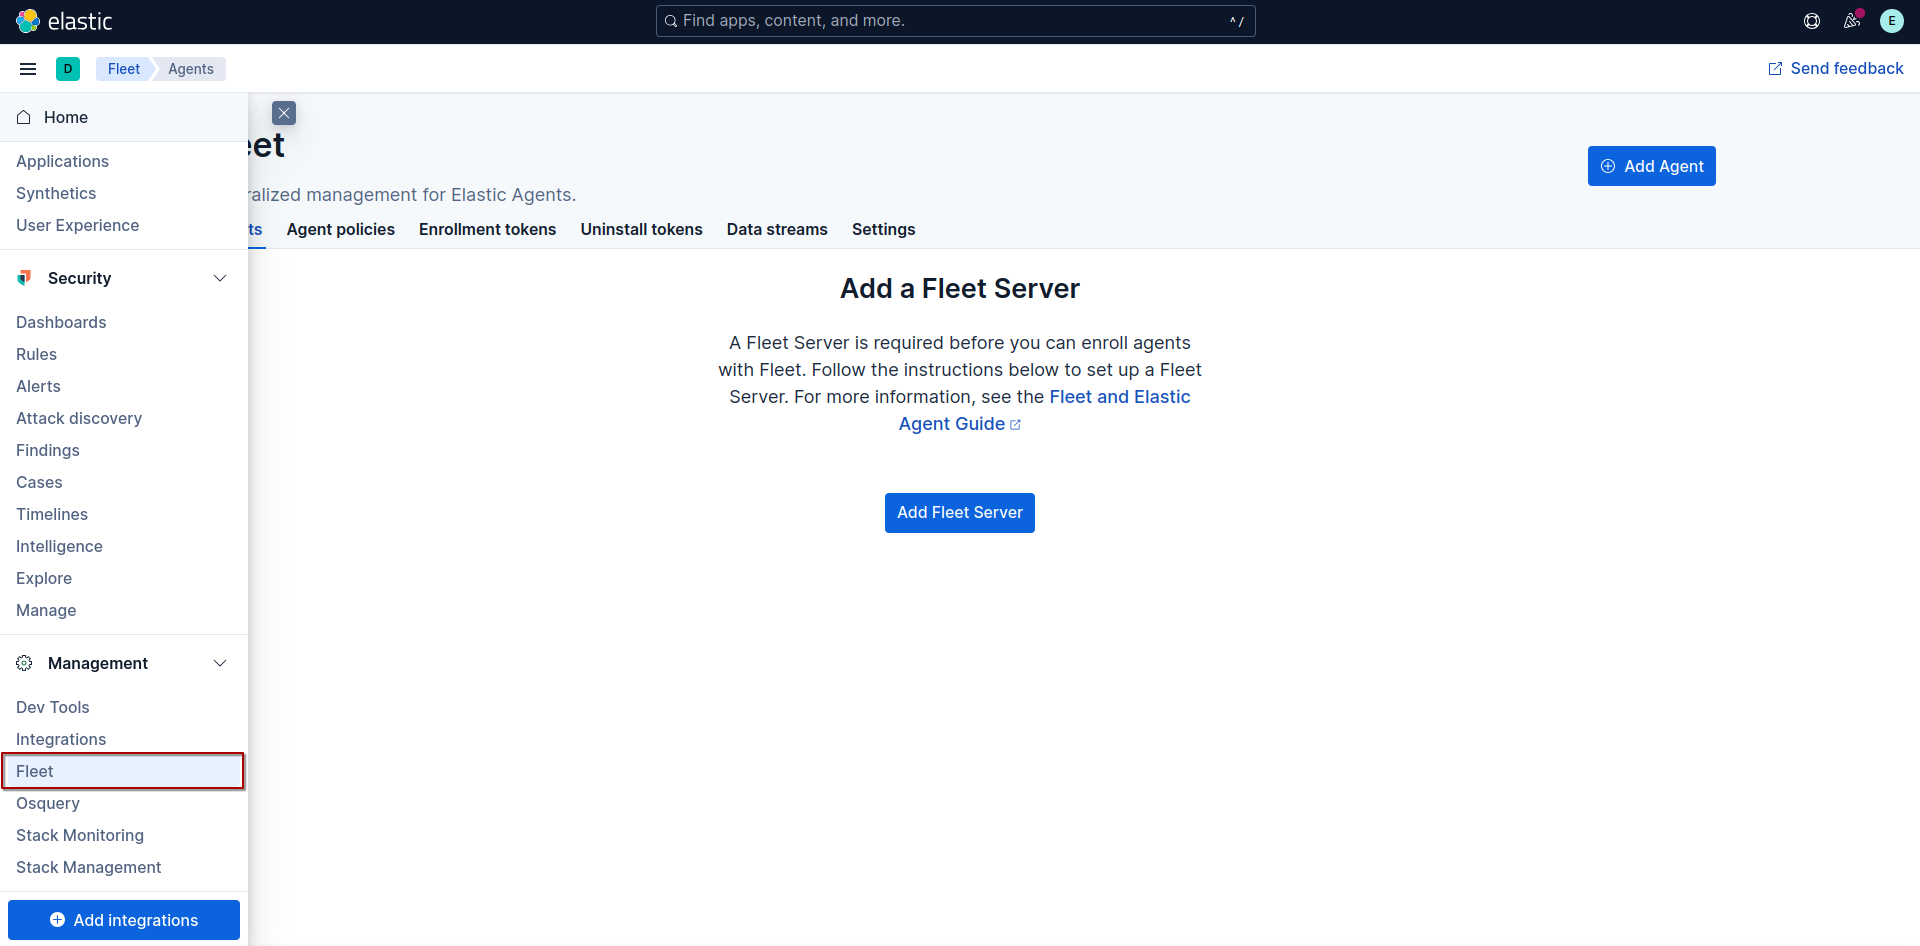
go to Management -> Fleet and click on Add Fleet Server
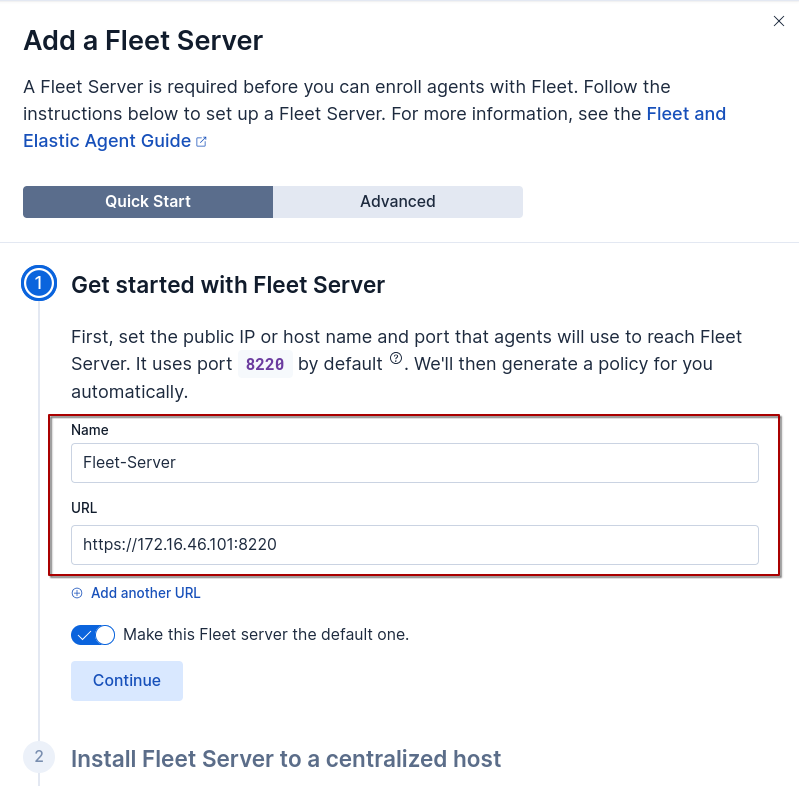
Set fleet server name and url to where fleet server will be running on and port it listen on. 8220 is the default listening port of fleet-server.
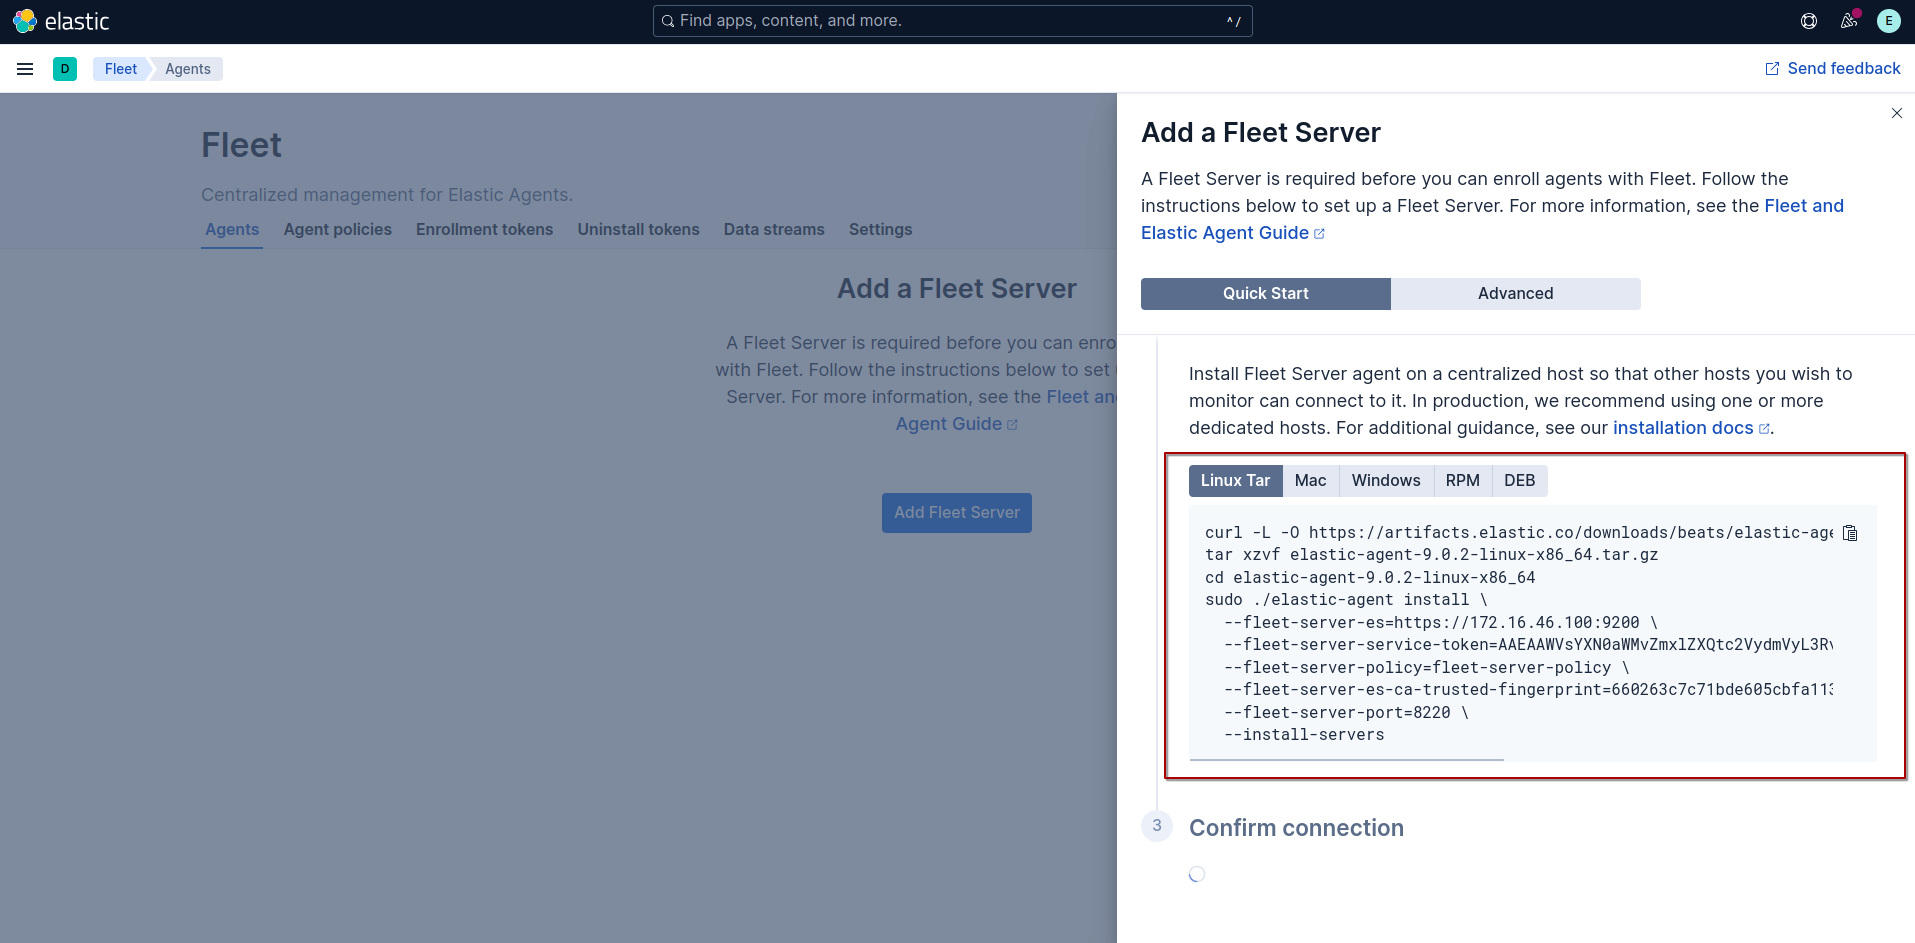
run command on the VM to install fleet-server agent.
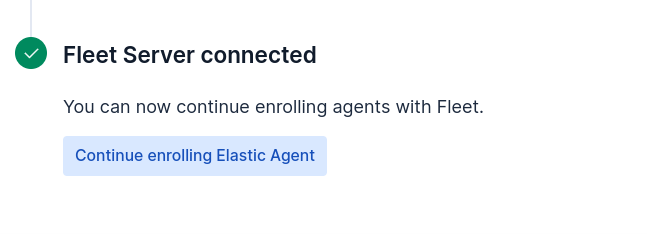
fleet-server is connected in kibana.
Sysmon
Note: I’am assuming you’ve already insatlled ADDS.
Sysmon will help us get more event that occurs on a windows endpoint.
You can download sysmon from here
In order for Sysmon to run, it requires a configuration file in XML format. This file includes an EventFiltering section where custom rules can be defined to include or exclude specific events based on conditions.
for example this rule include events with id 10 (ProcessAccess) base on image name and process access.
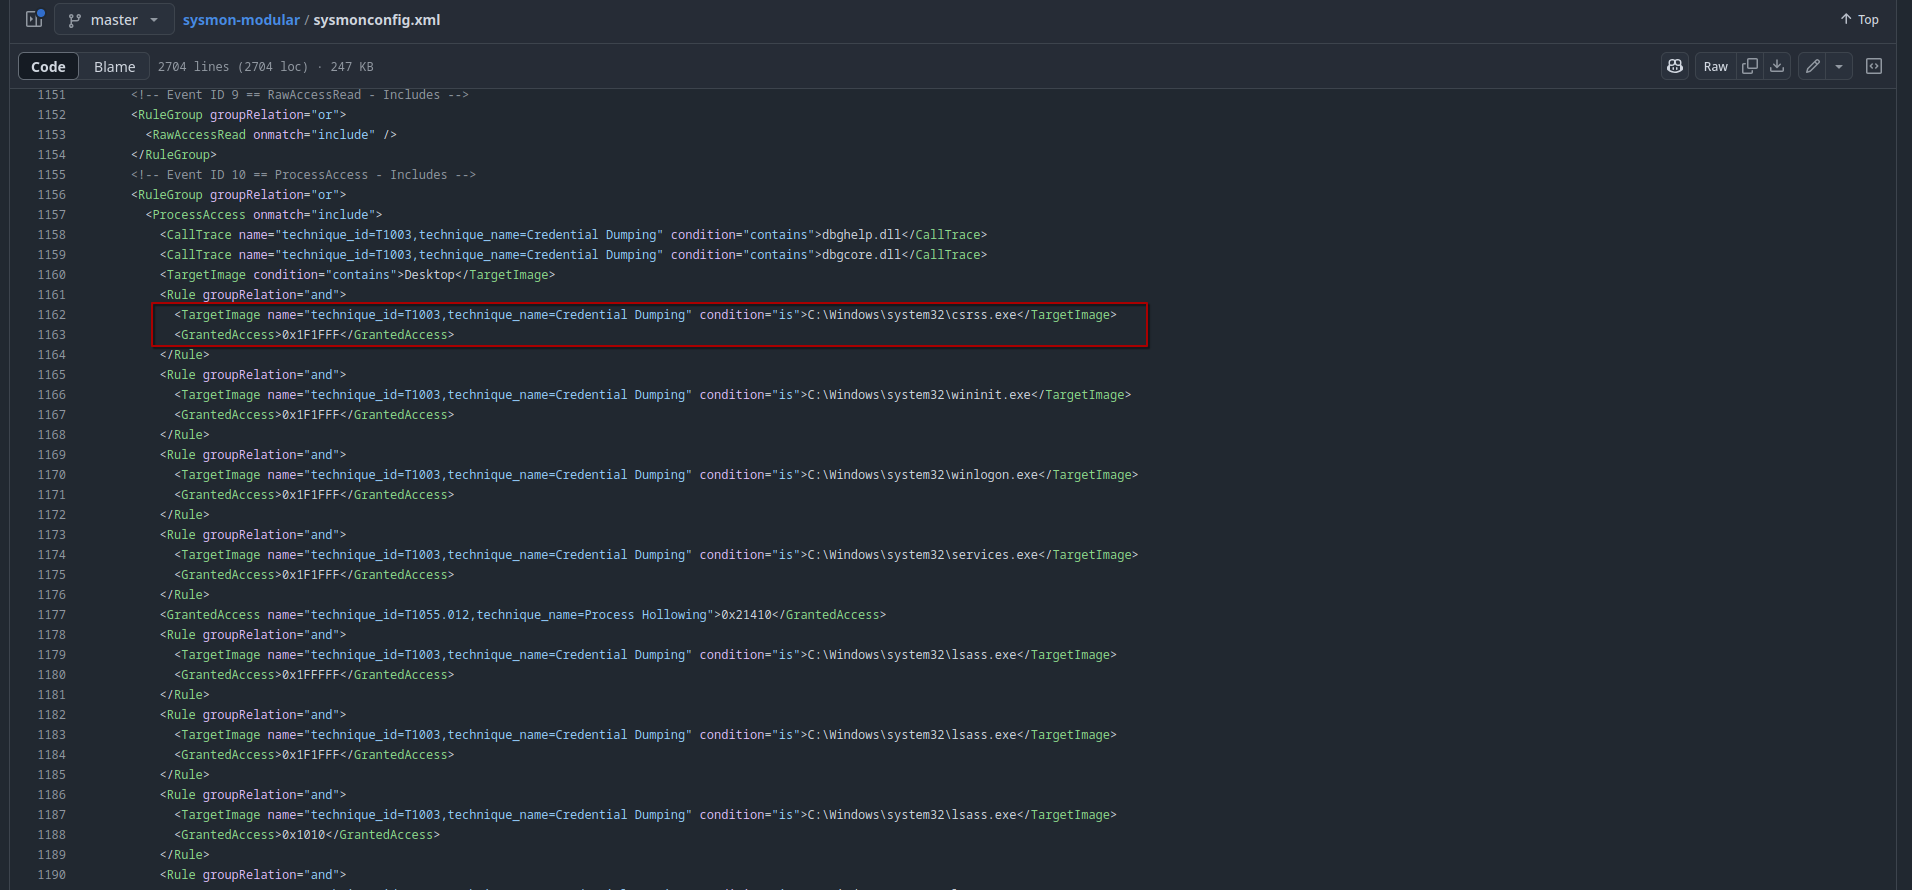
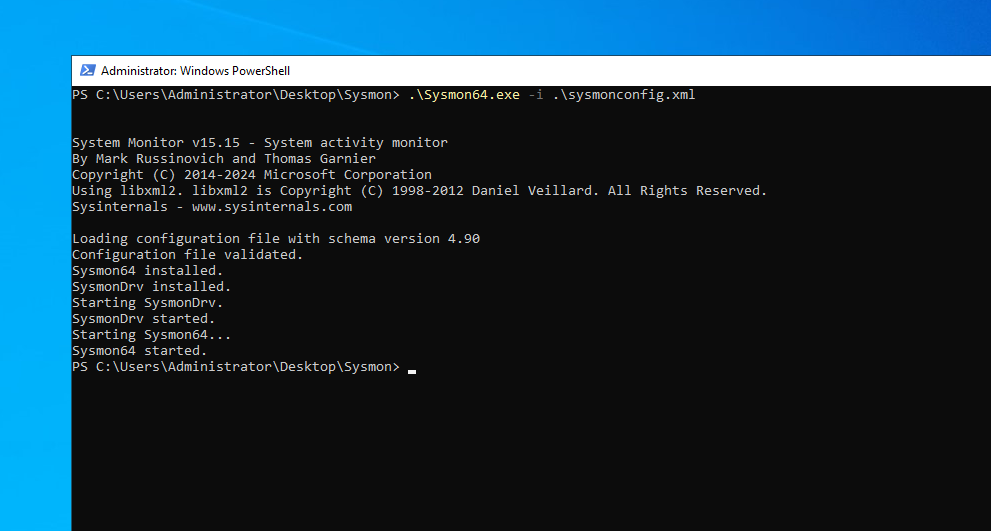
in this lab setup i’ll be using Olaf Hartong sysmon config. lets now install sysmon.
Elastic Agent
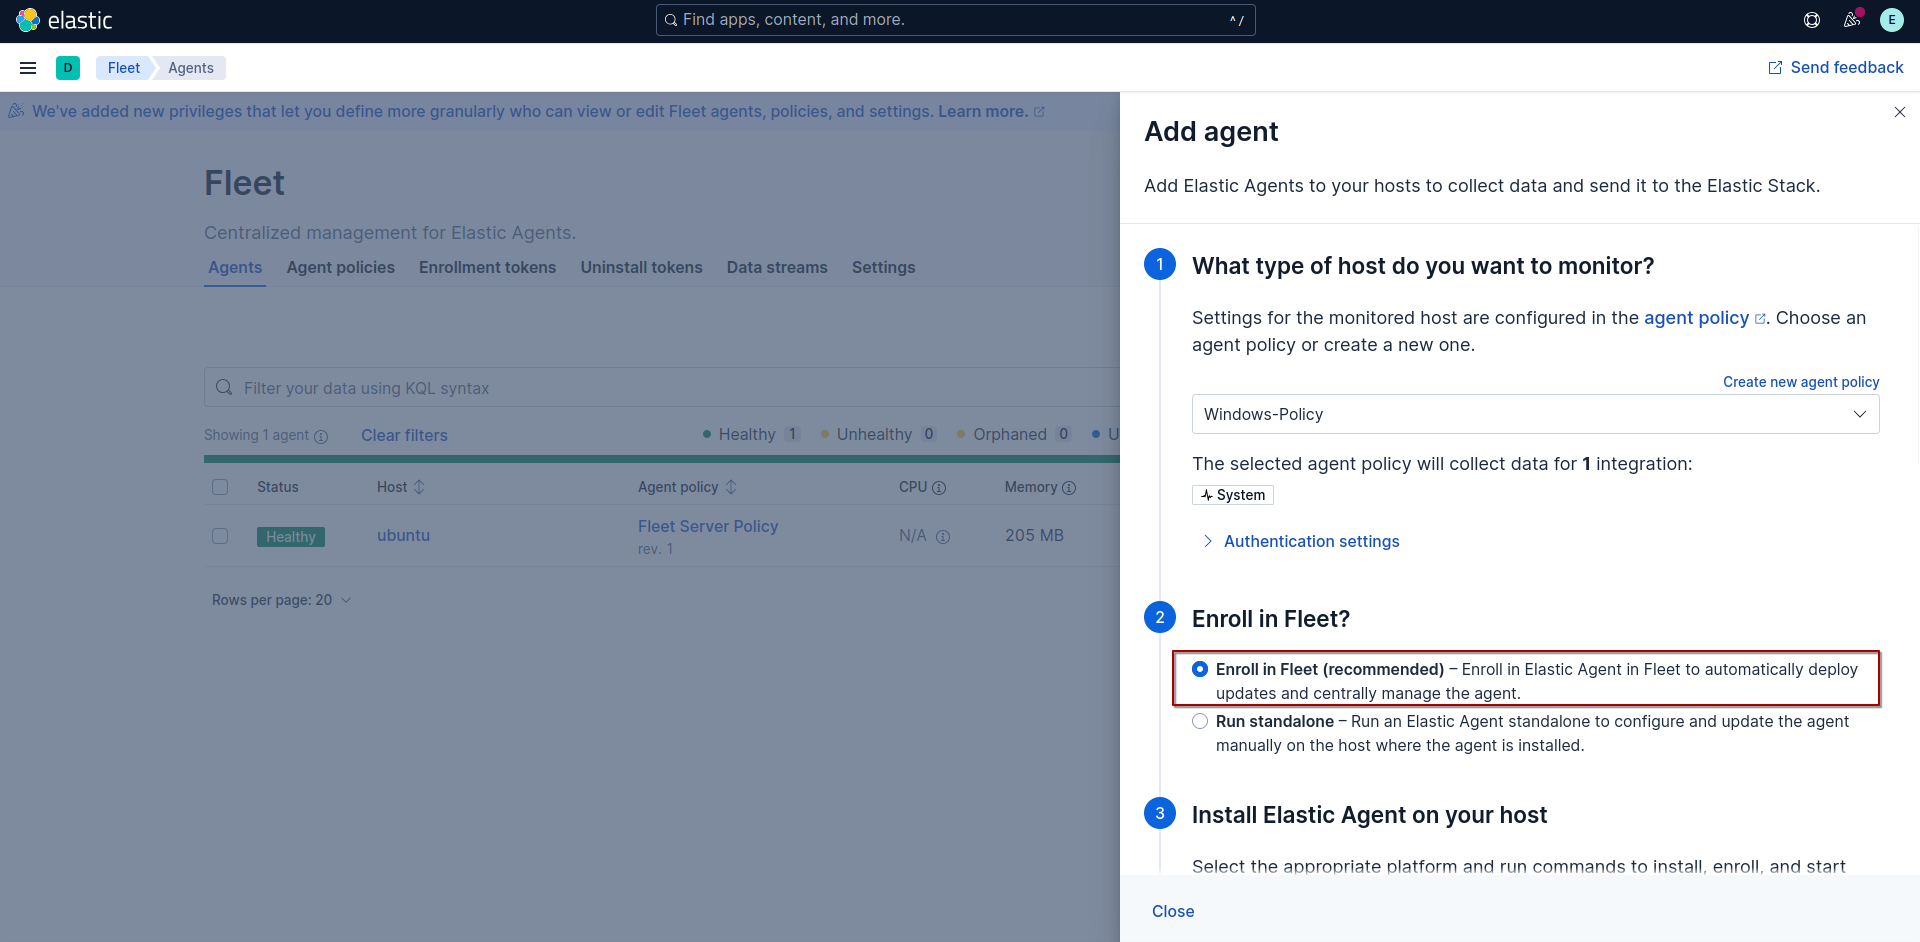
Elastic Agent is a single, unified way to add monitoring for logs, metrics, and other types of data to hosts. we can install an agent on a host by clicking Add Agent and set a name for policy we want to create.
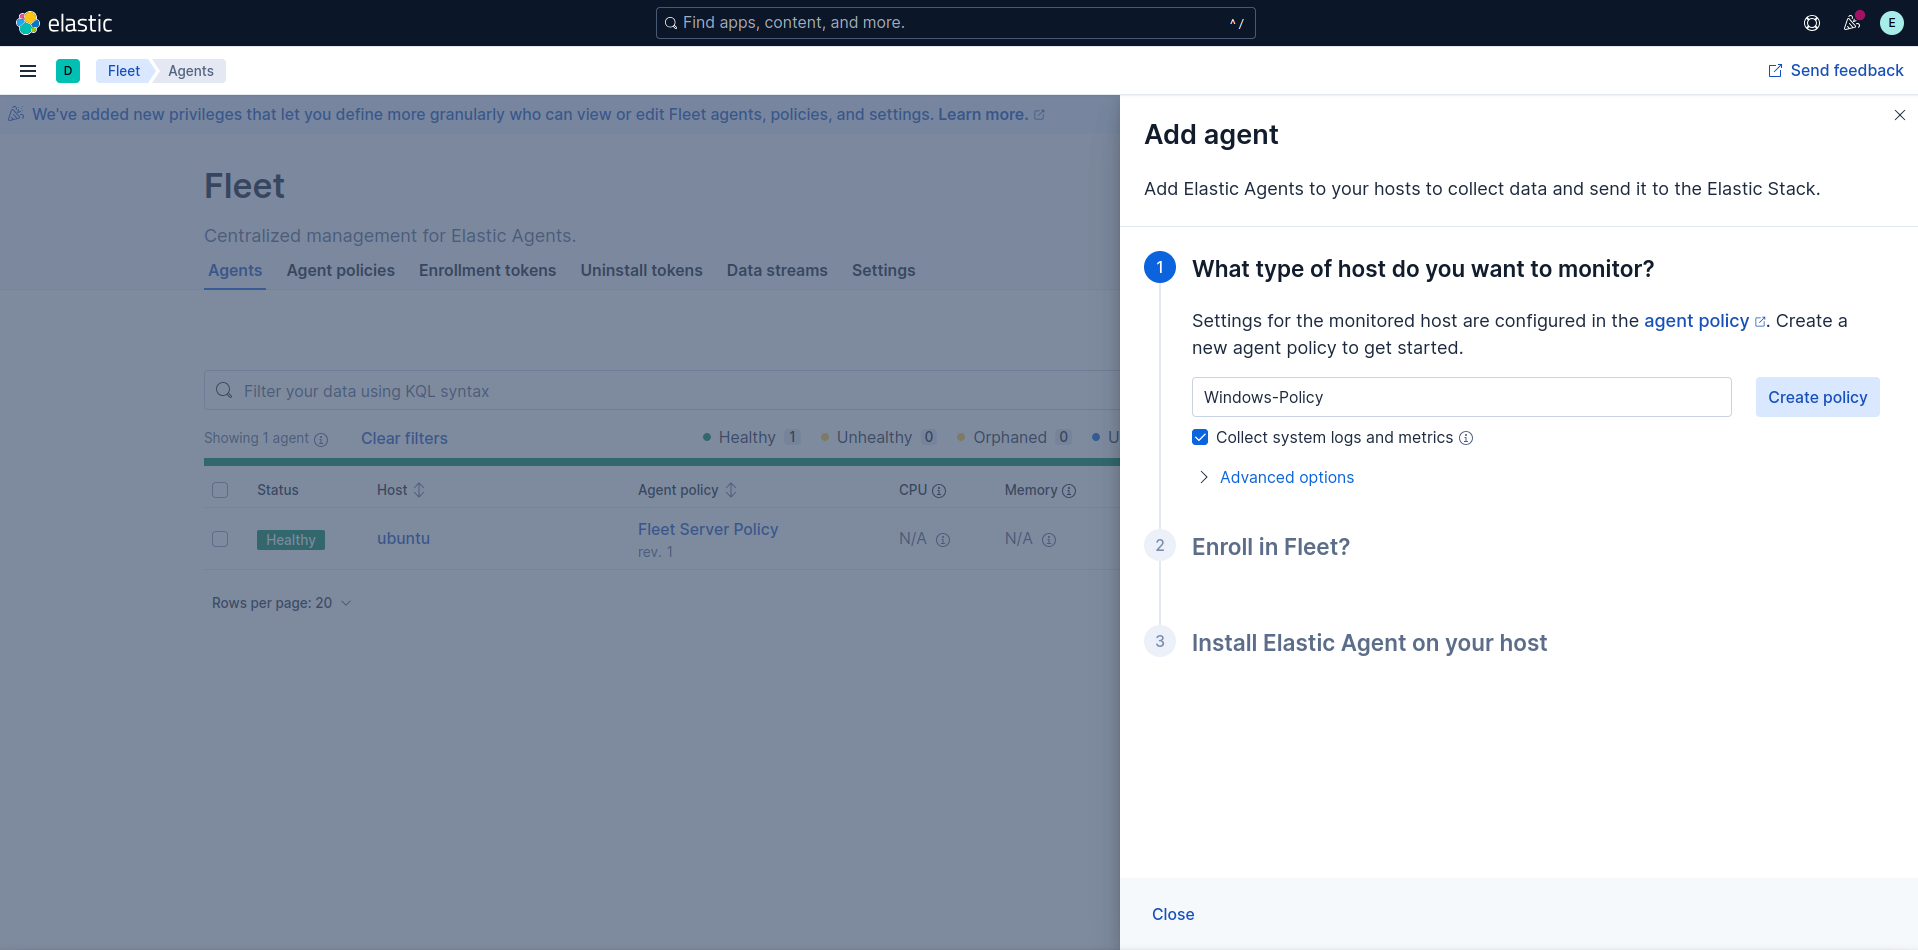
then select Enroll in Fleet
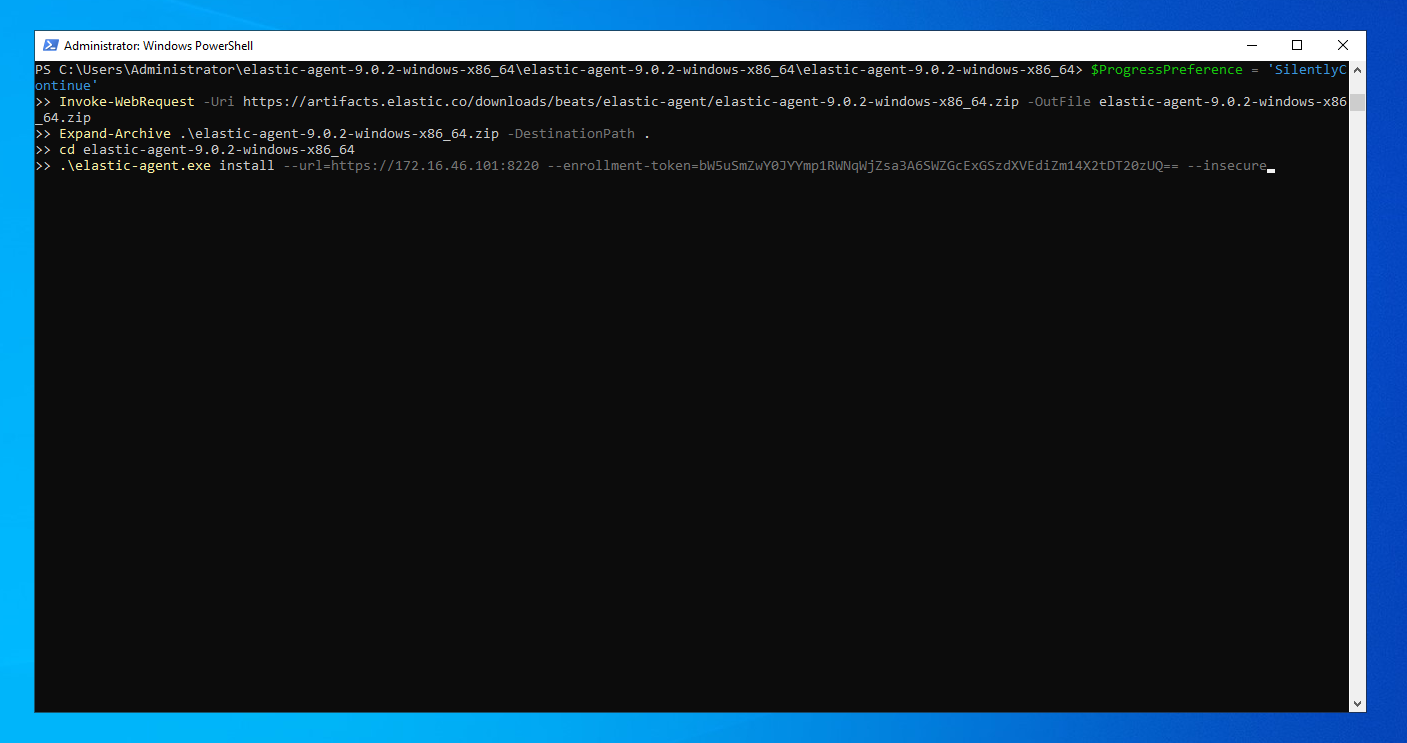
select windows then copy and run the command on the domain controller.
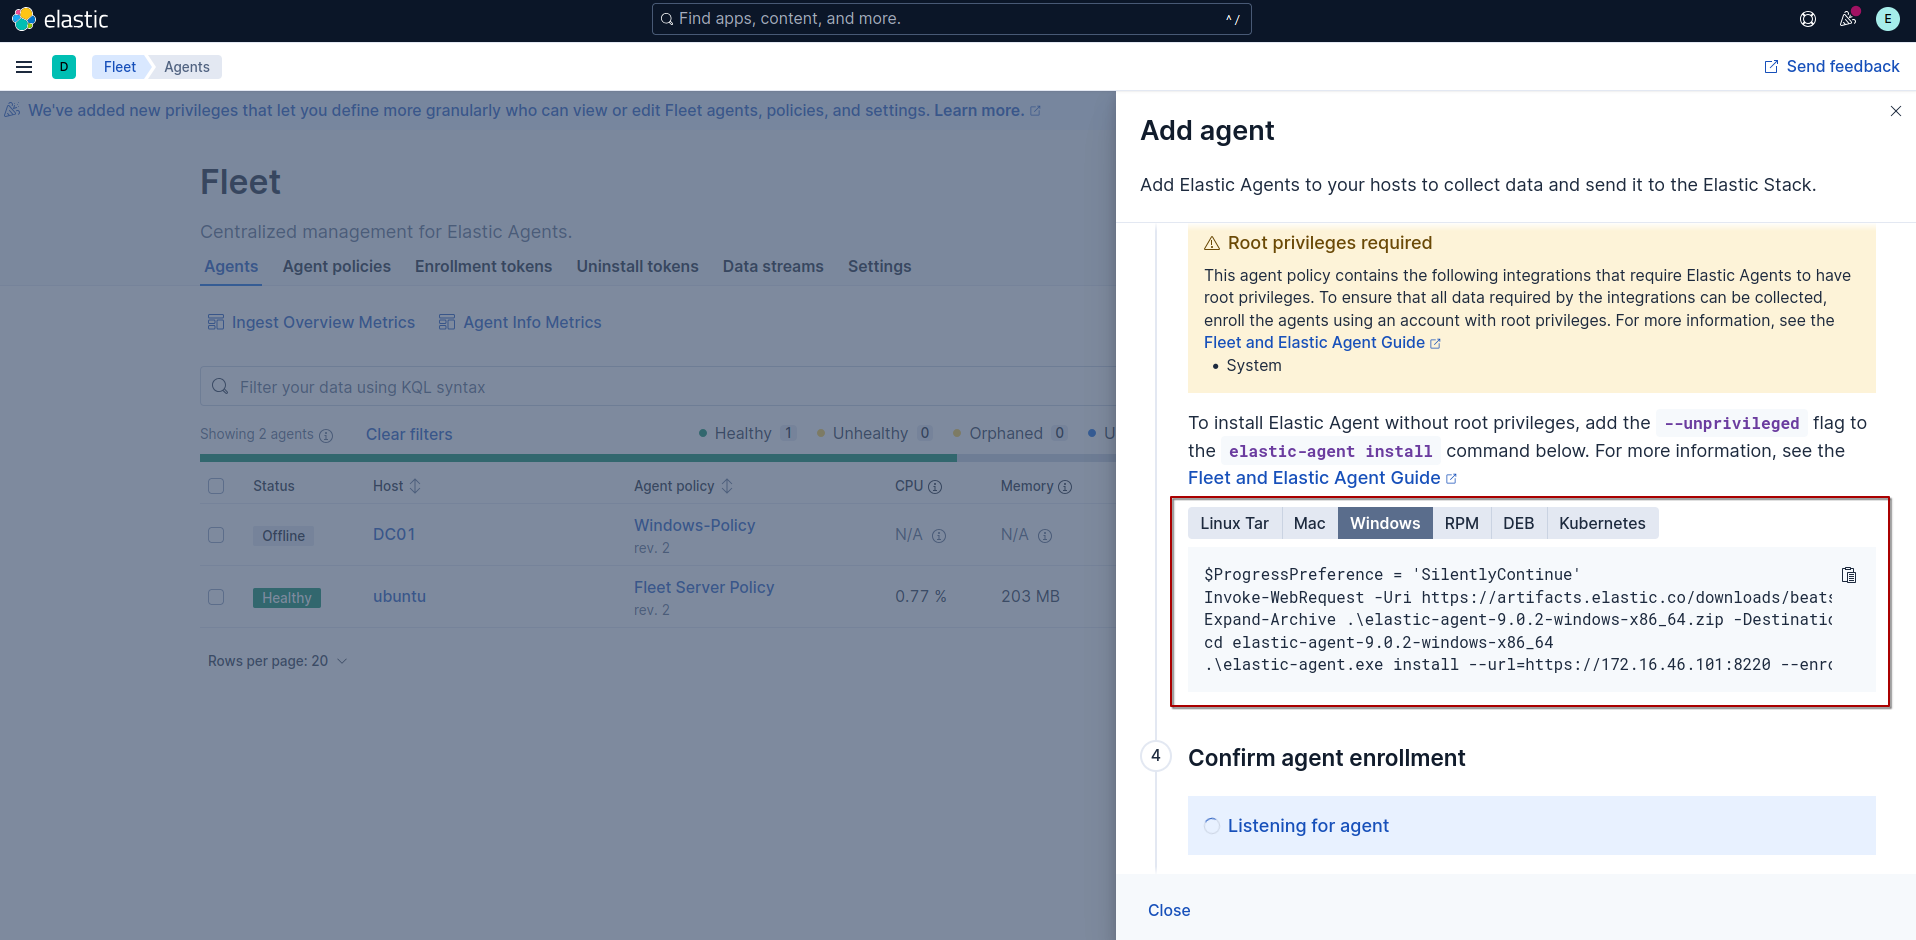
One thing to add is you’ll need to add --insecure to the last command to ignore self-signed certificate warnings.
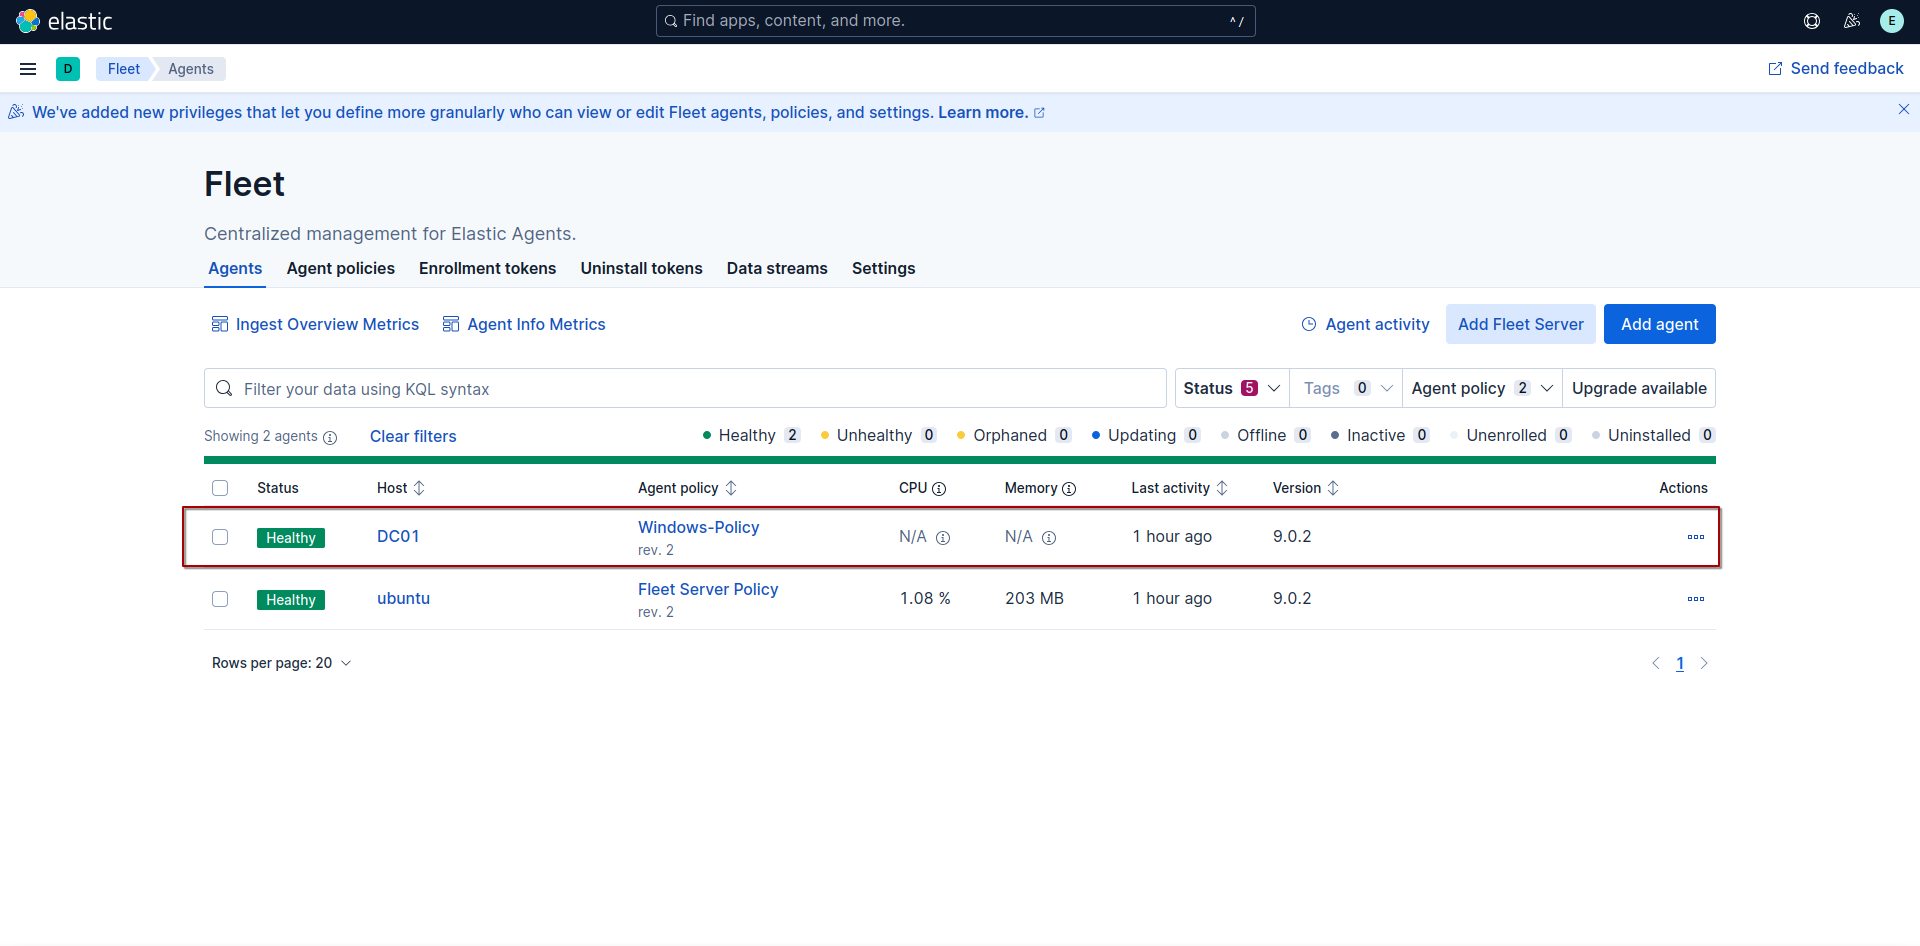
once the installation is finished we can see that DC01 is added to agents in our dashboard
Ingesting Sysmon and Windows Defender logs
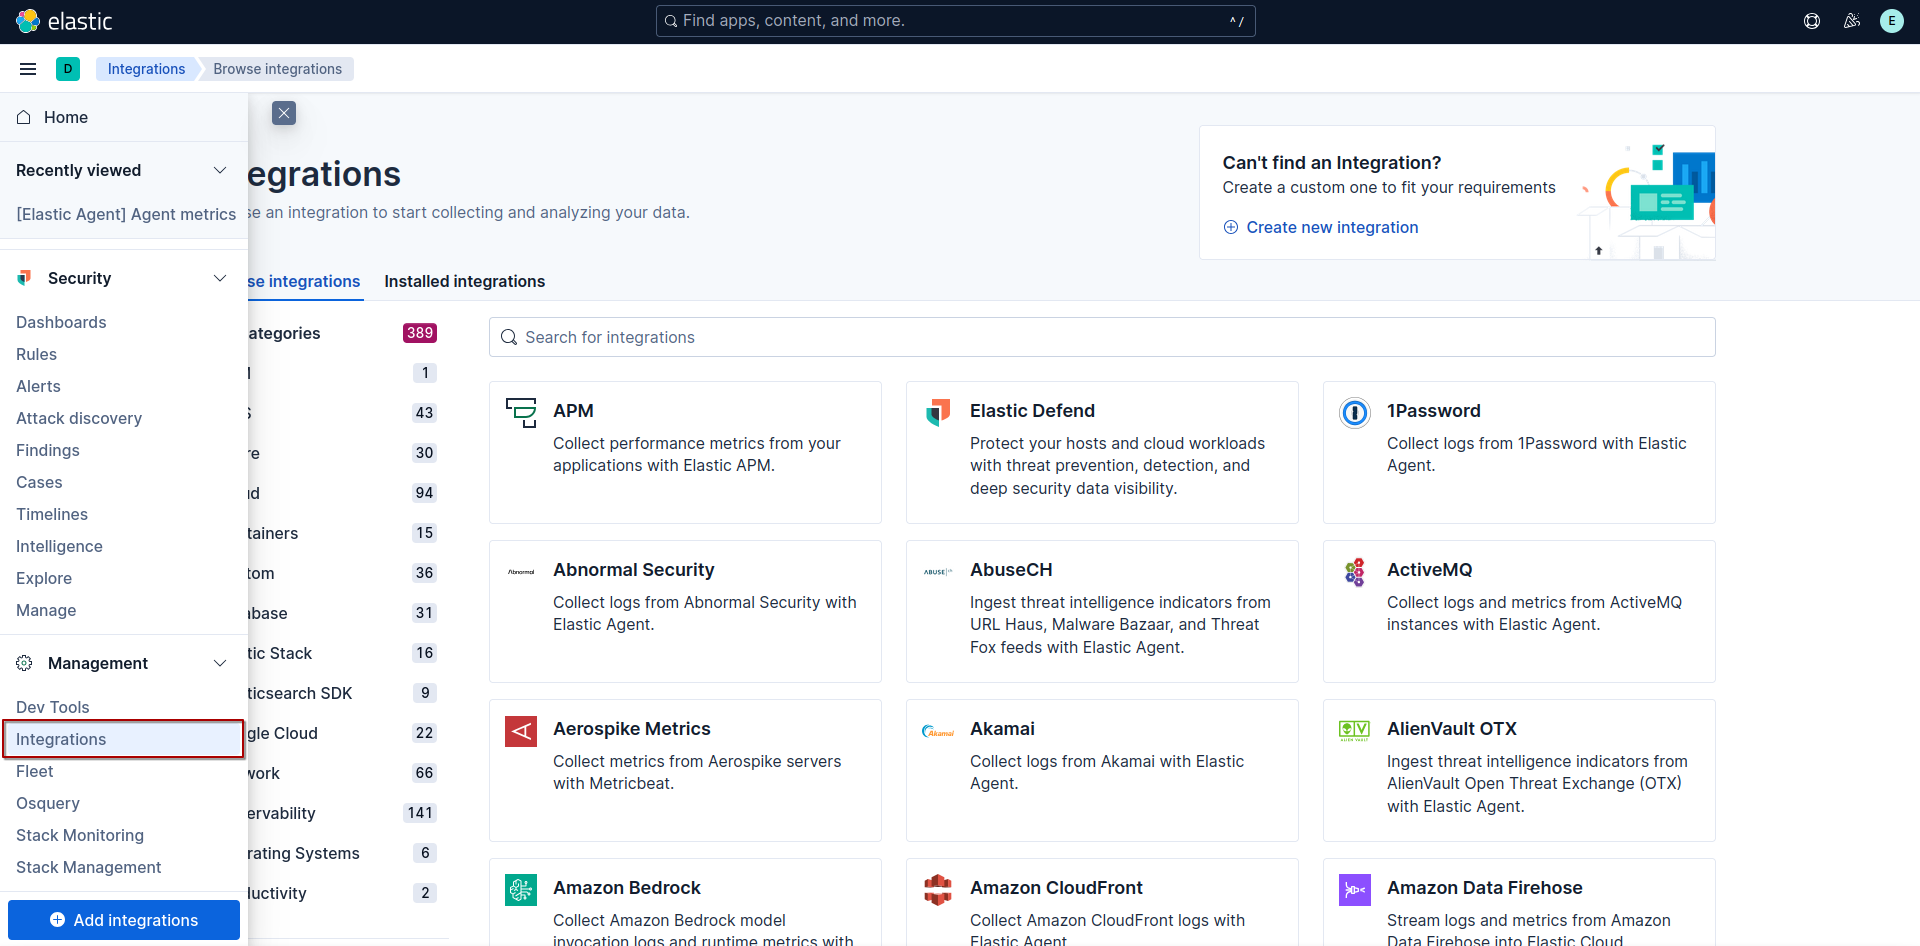
One last step to finish this lab setup is ingesting sysmon and windows defender logs into elasticsearch. first will add new integration by going to Management -> Integration page.
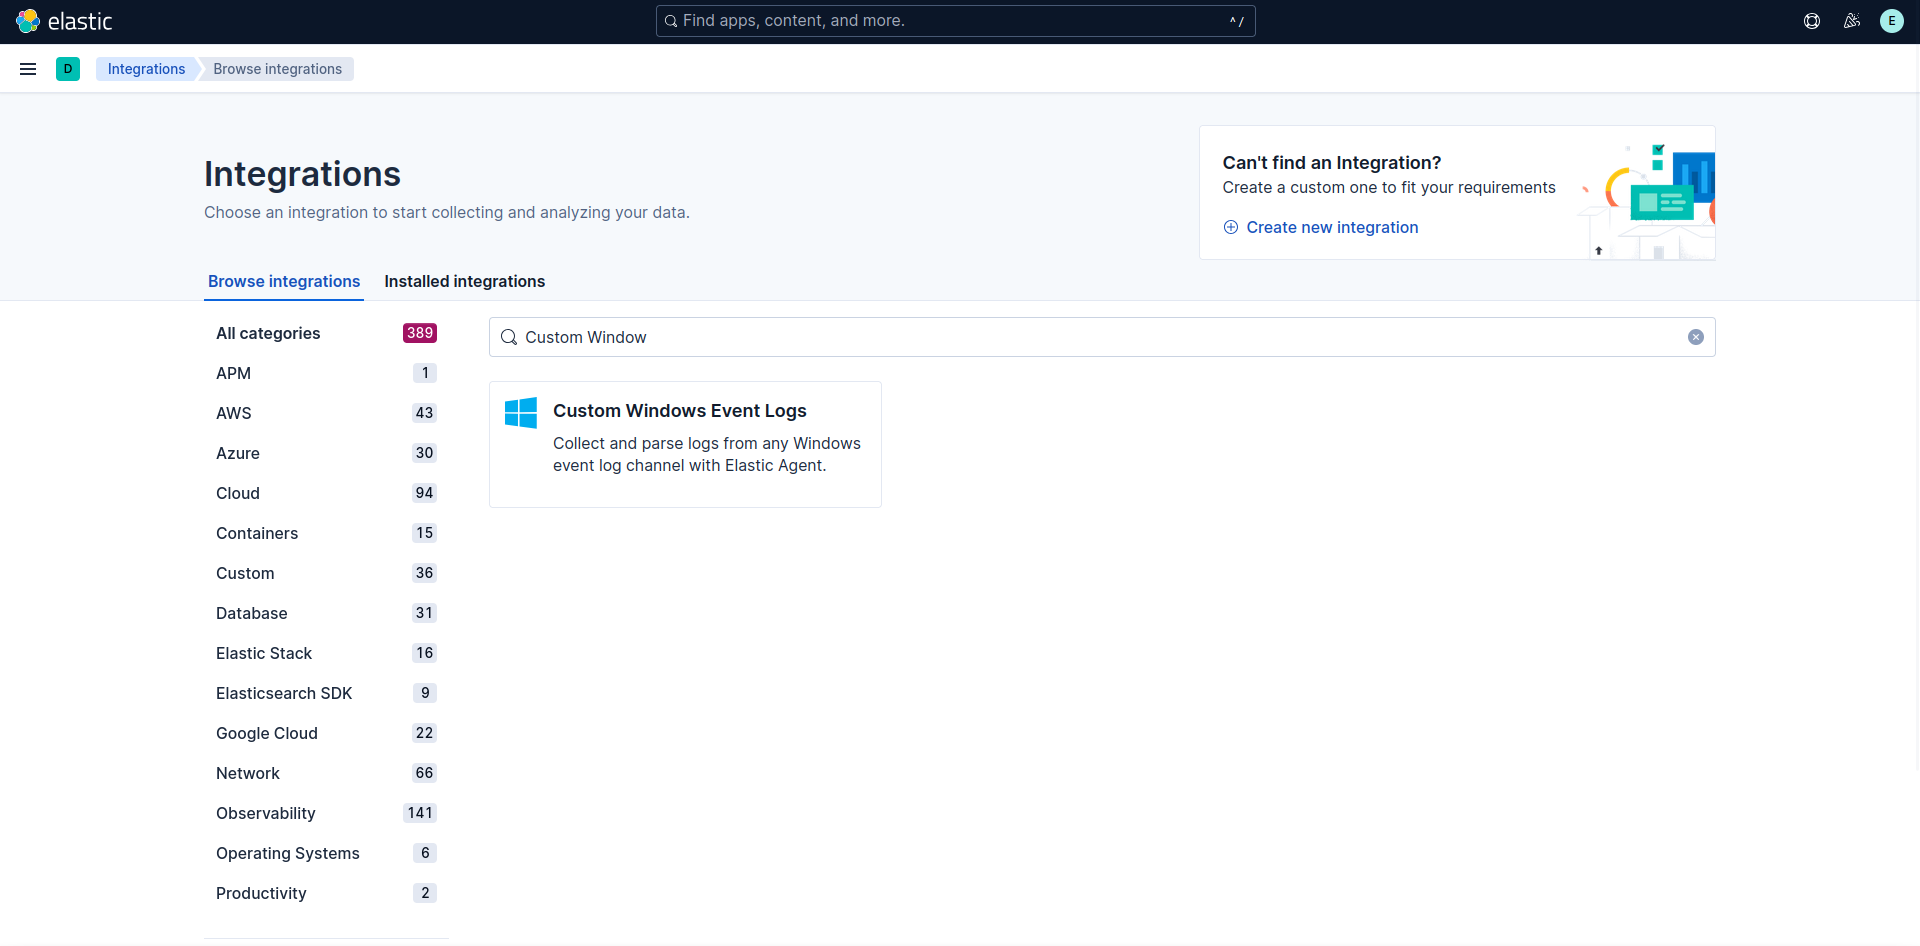
then search for Custom Windows Event Logs.
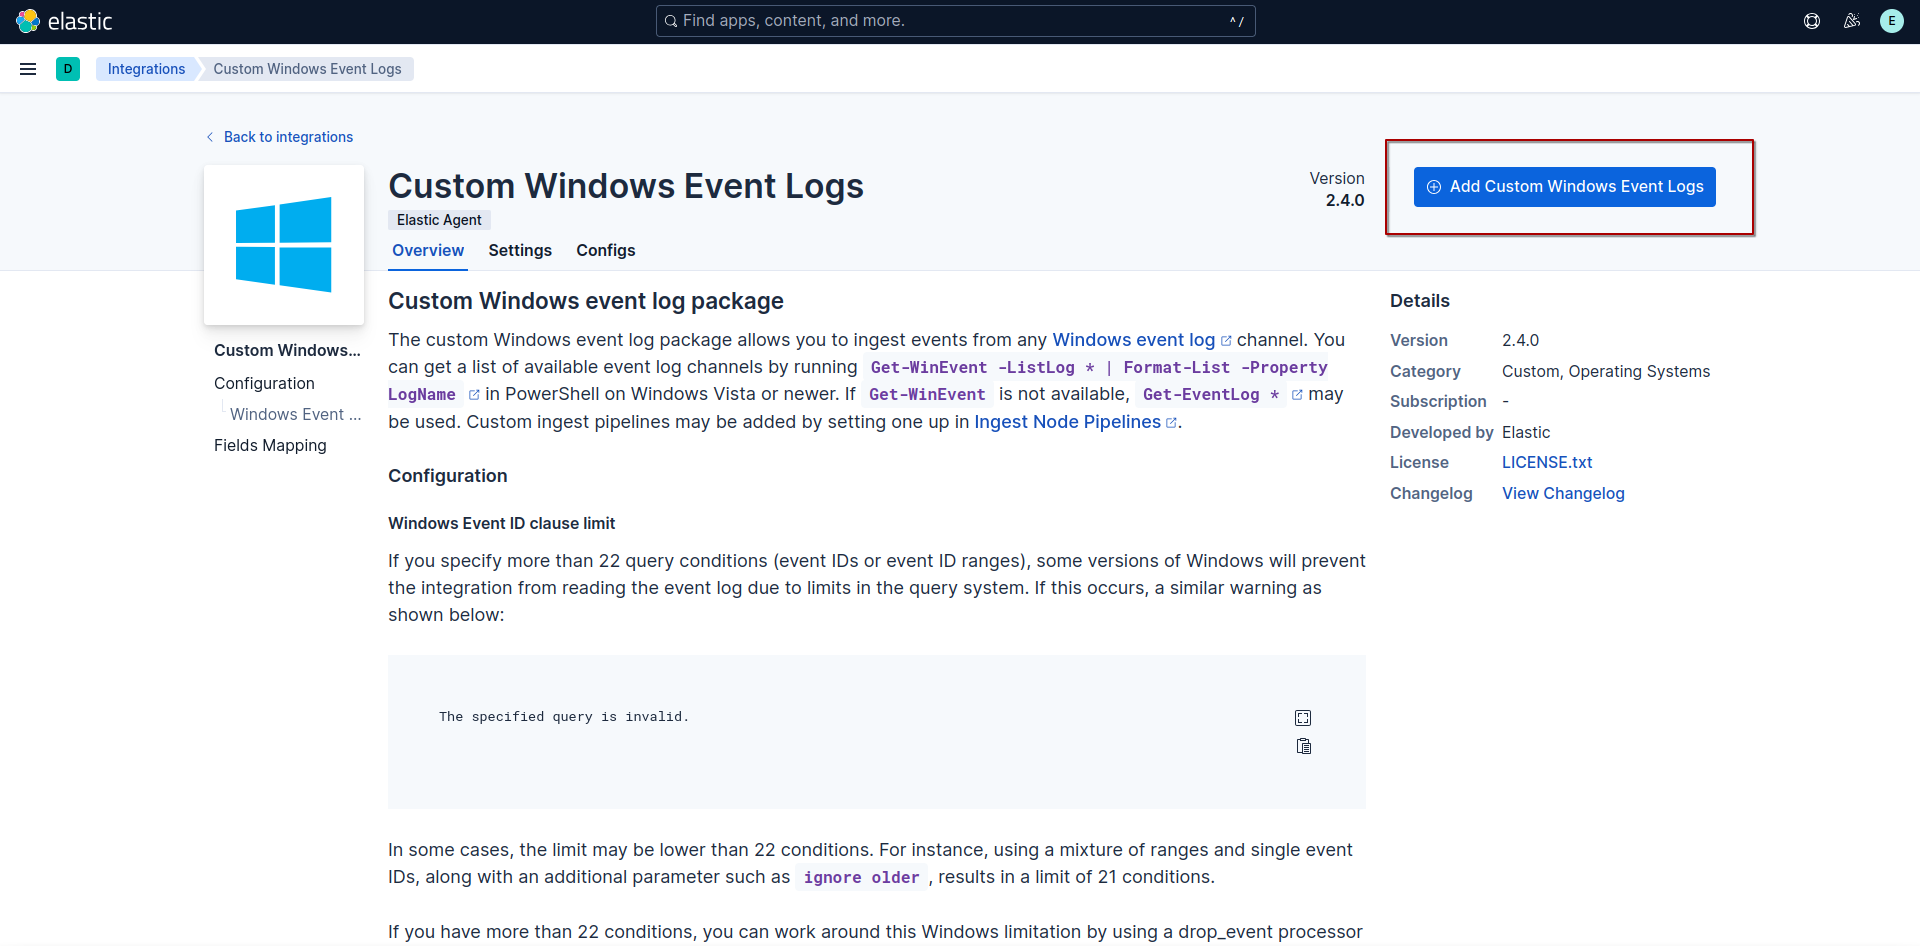
click on Add Custom Windows Event Logs
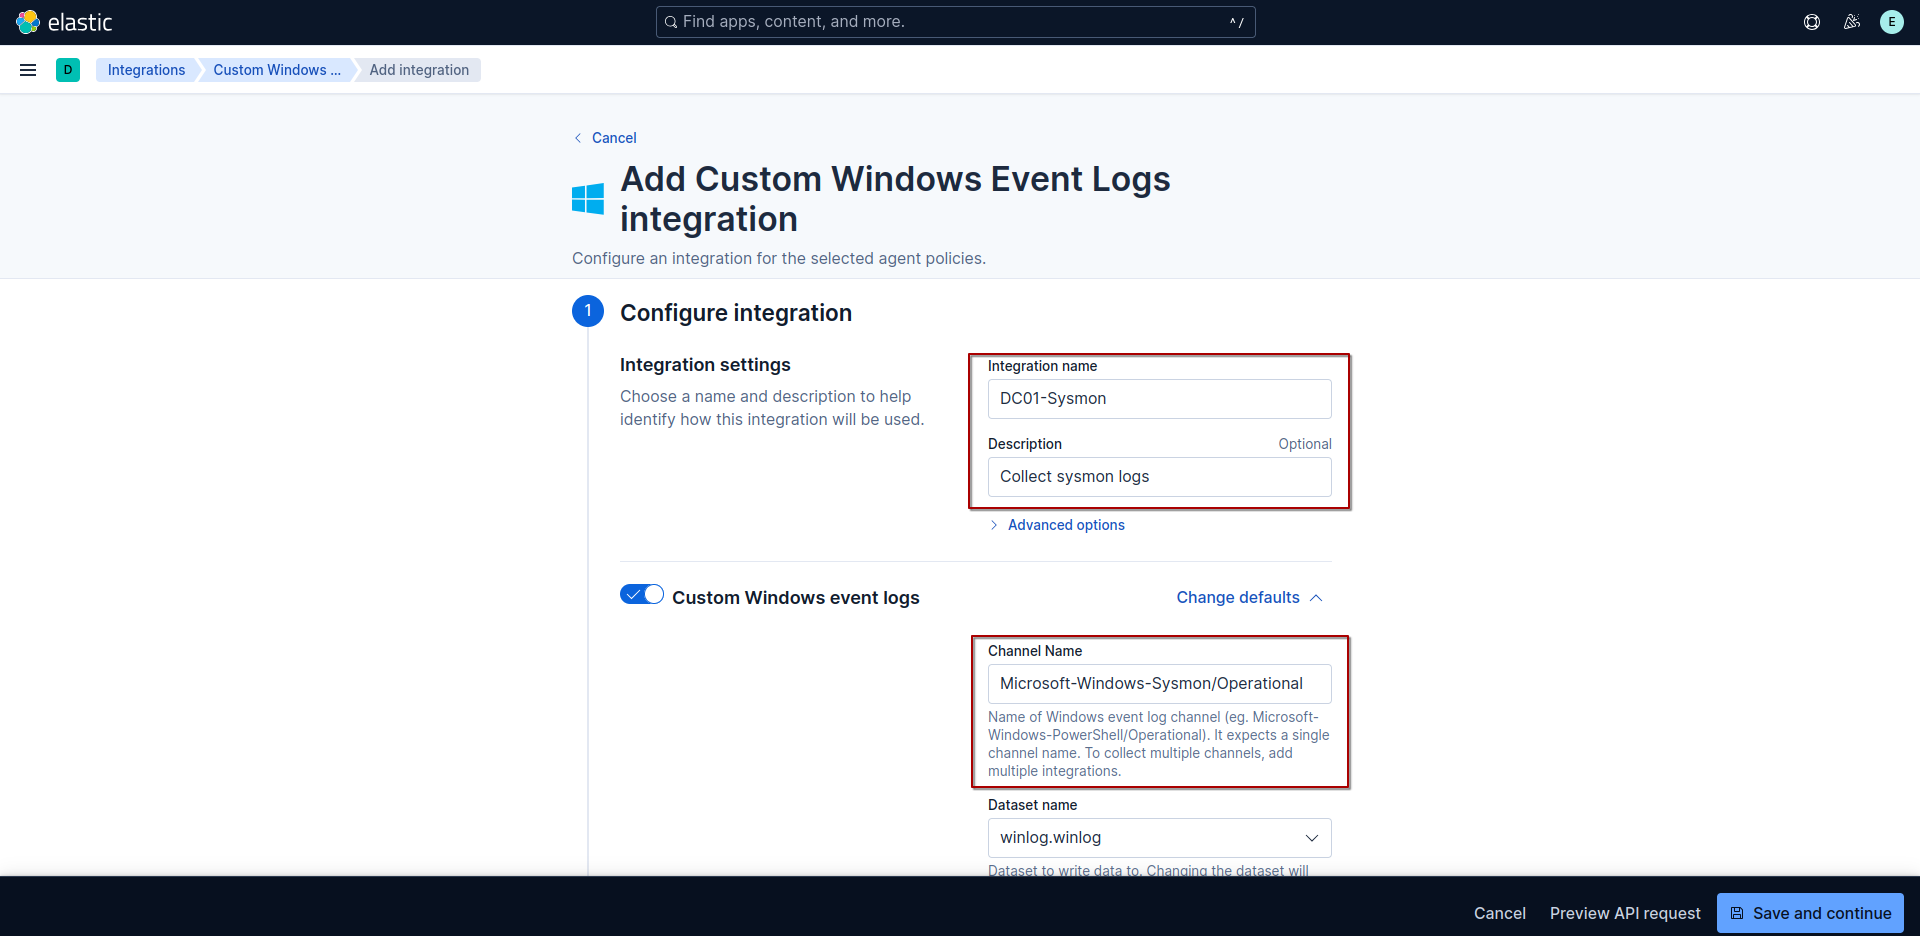
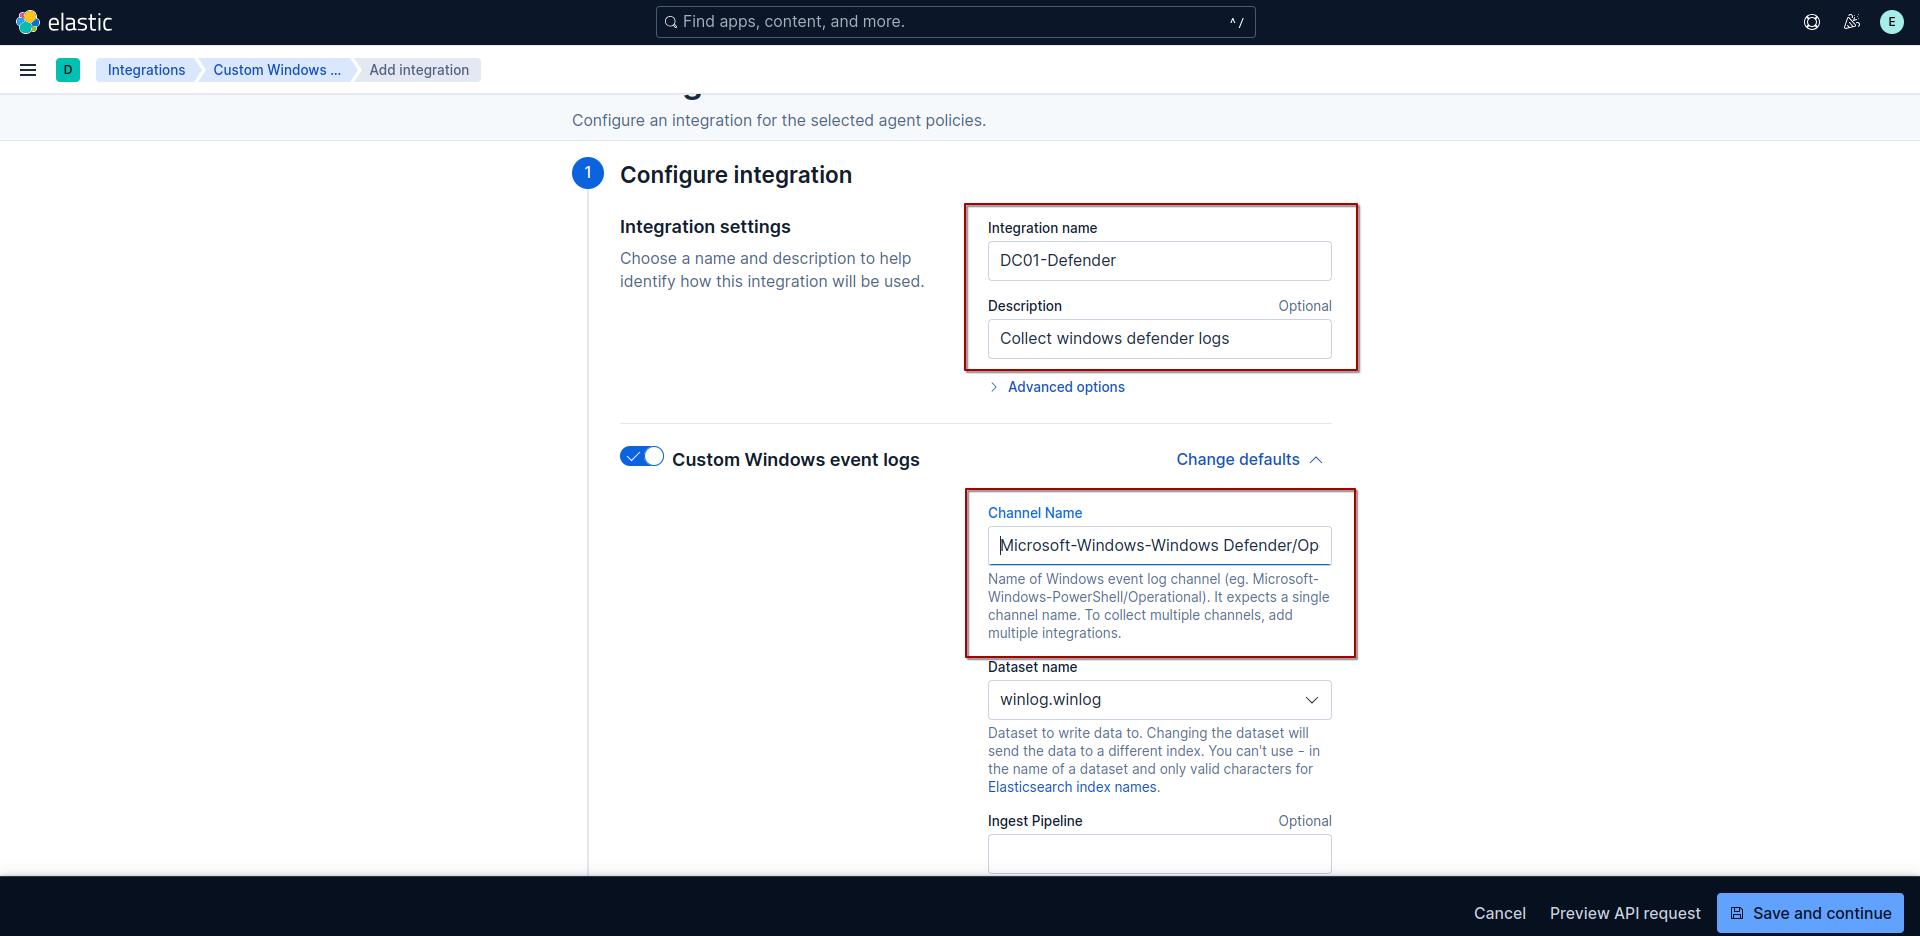
fill the integration configuration.
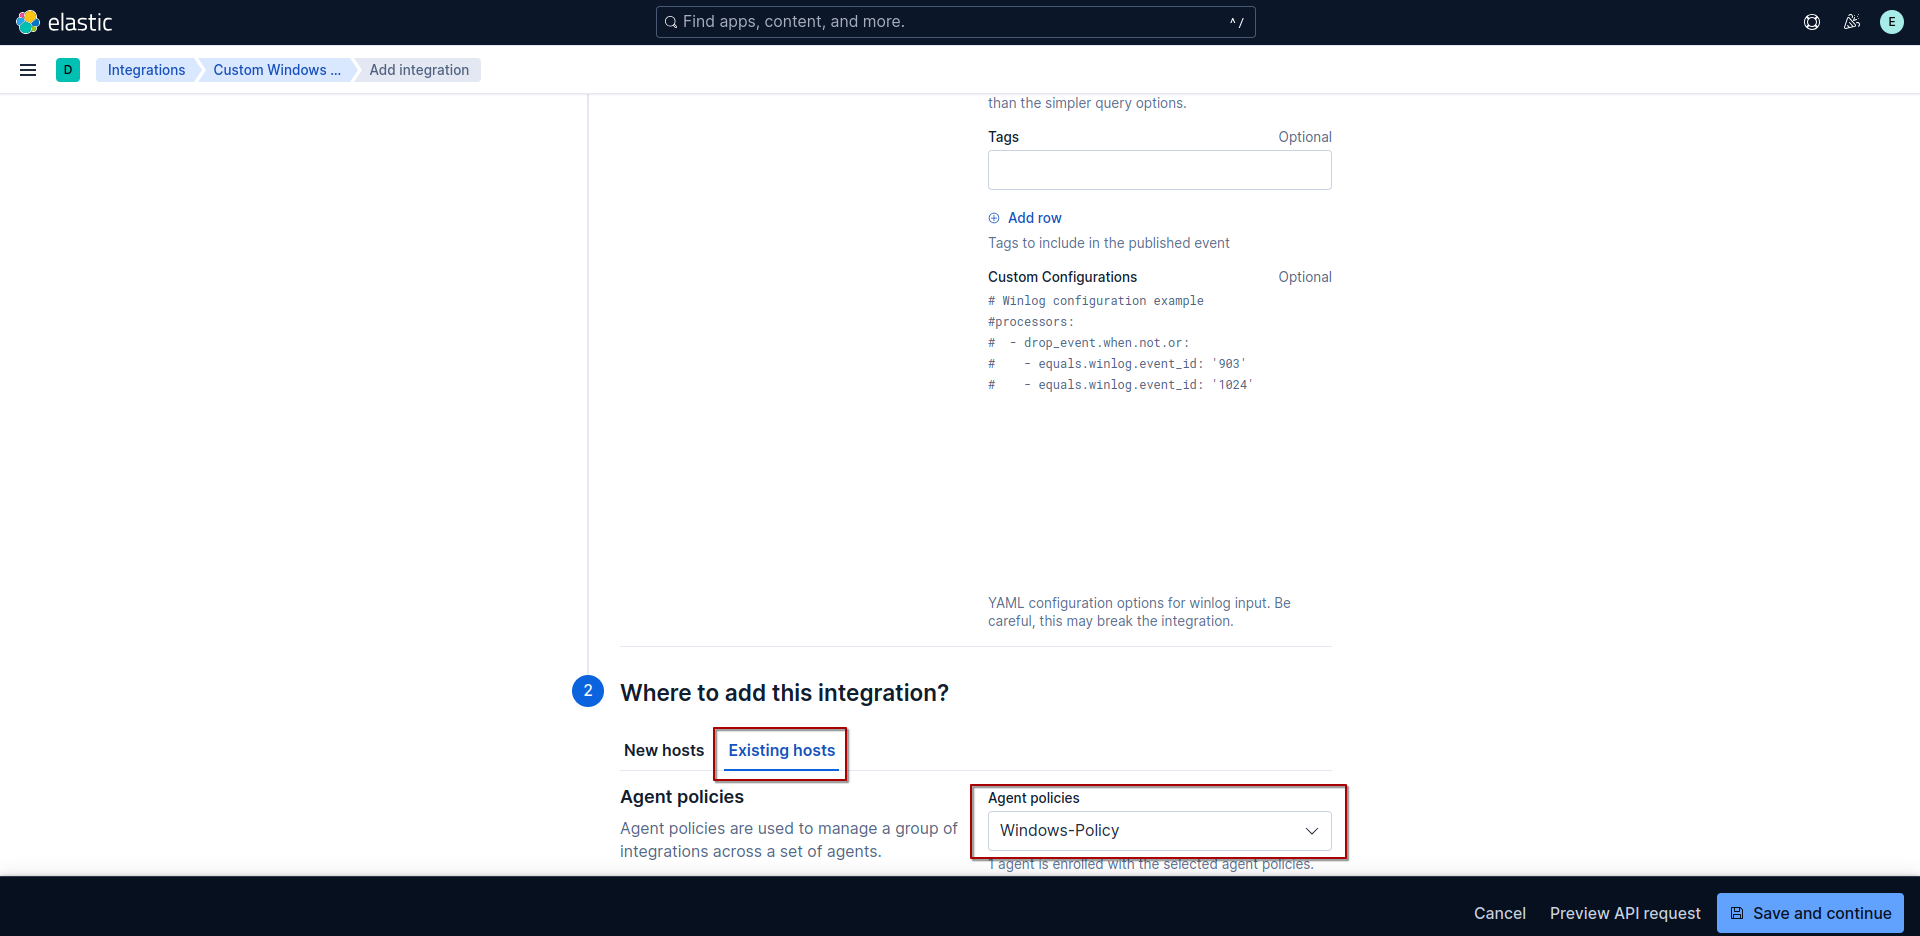
select hosts to apply the integration to.
then click on Save and continue.
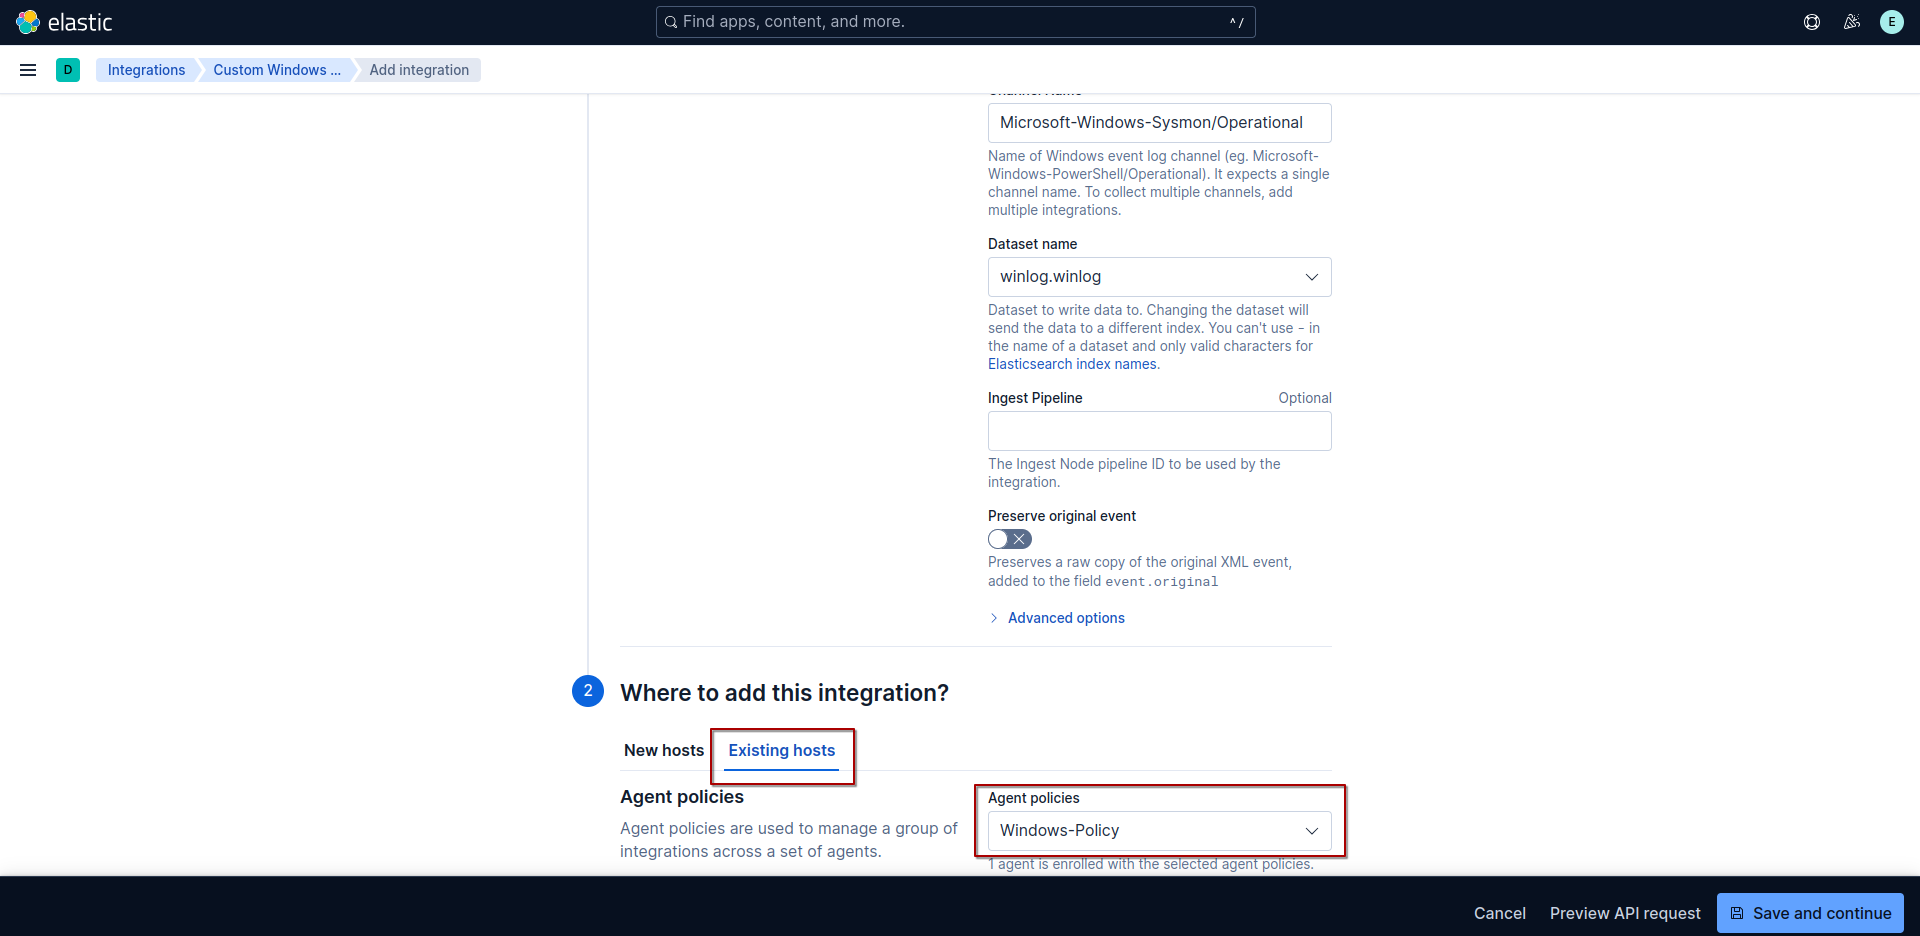
we also need to add windows defender logs. set channel name to Microsoft-Windows-Windows Defender/Operational.
for windows defender logs we only want to include the events 1116 (MALWAREPROTECTION_STATE_MALWARE_DETECTED), 1117 (MALWAREPROTECTION_STATE_MALWARE_ACTION_TAKEN) and 5001 (MALWAREPROTECTION_RTP_DISABLED). to do this we click on advance options and add those event IDs.

then we select the hosts we want add integration to and click on Save and continue
Testing our lab
Sysmon
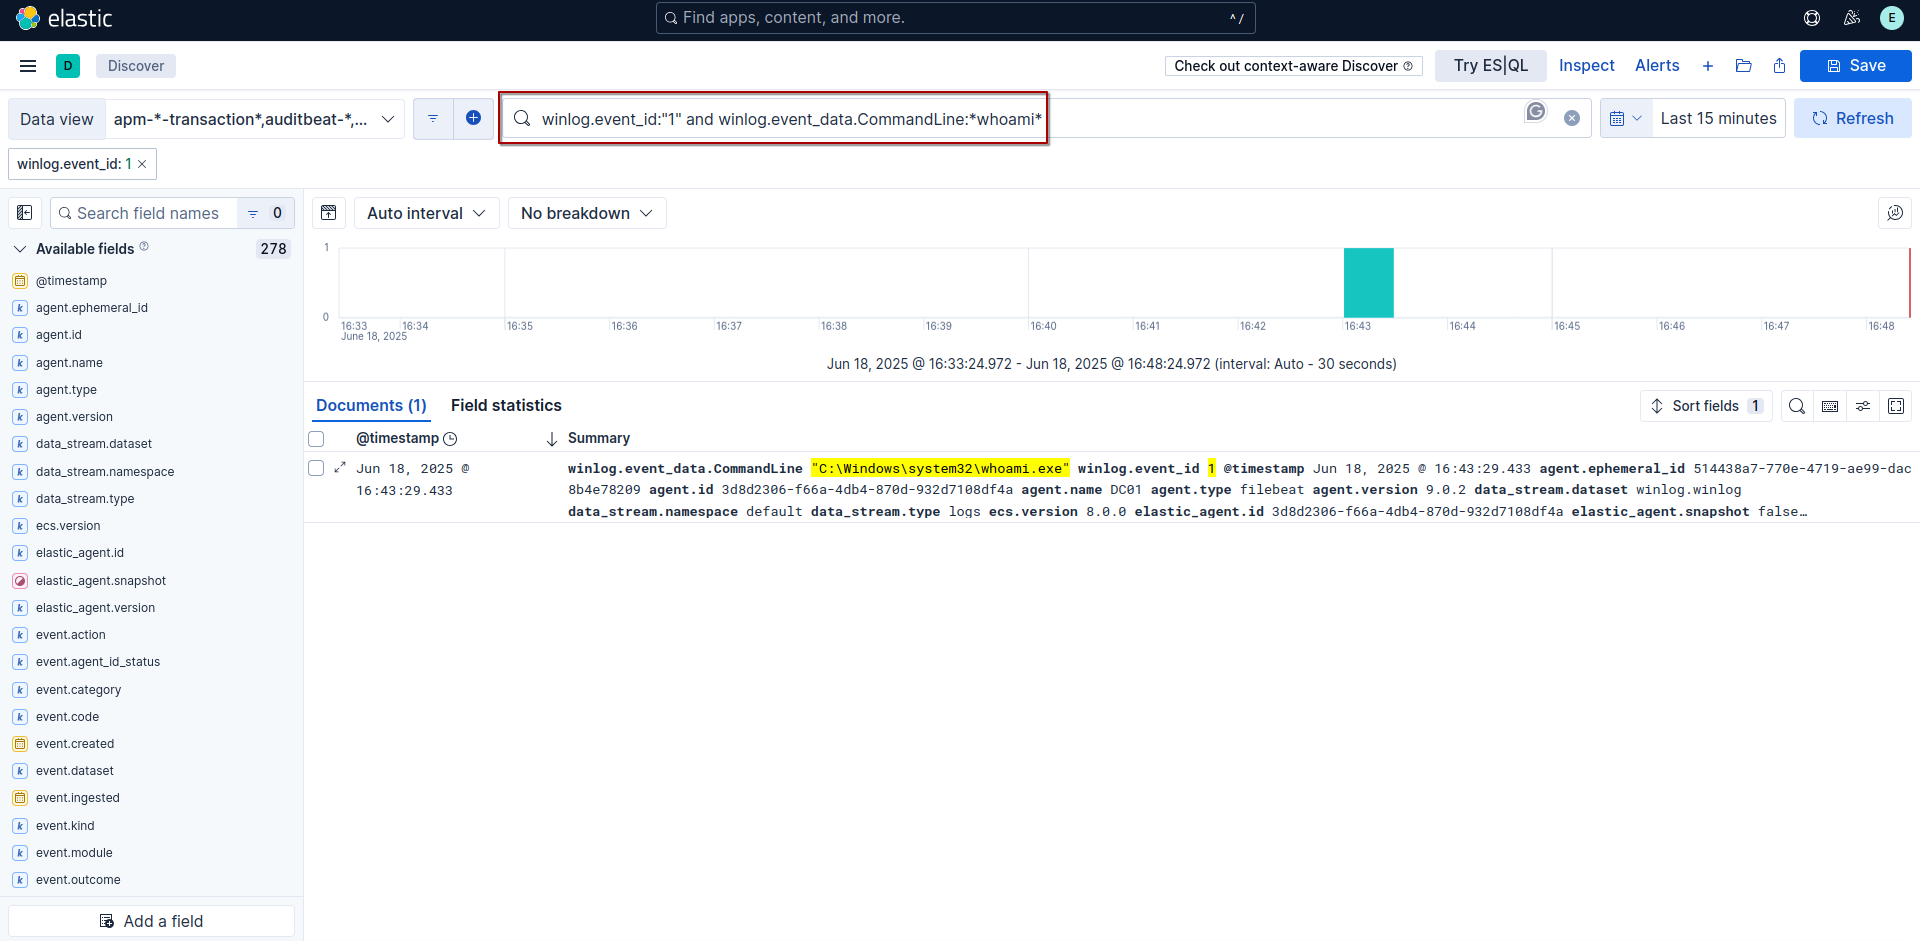
to confirm that sysmon logs are been ingested into elasticsearch lets run the command whoami.exe.
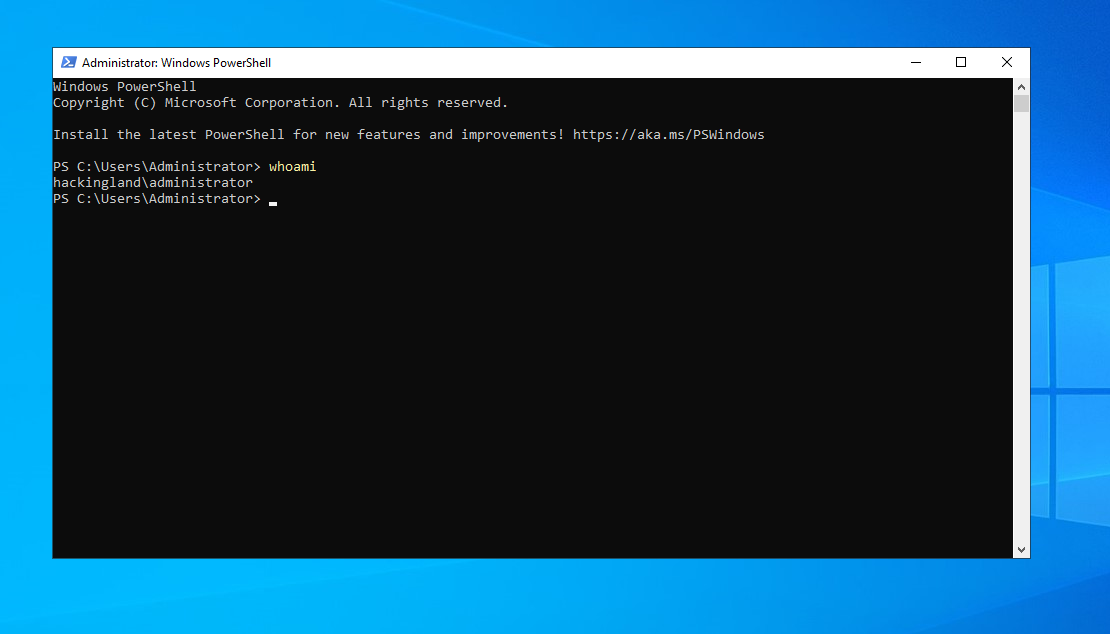
now let’s use the following filter winlog.event_id:"1" and winlog.event_data.CommandLine:*whoami*
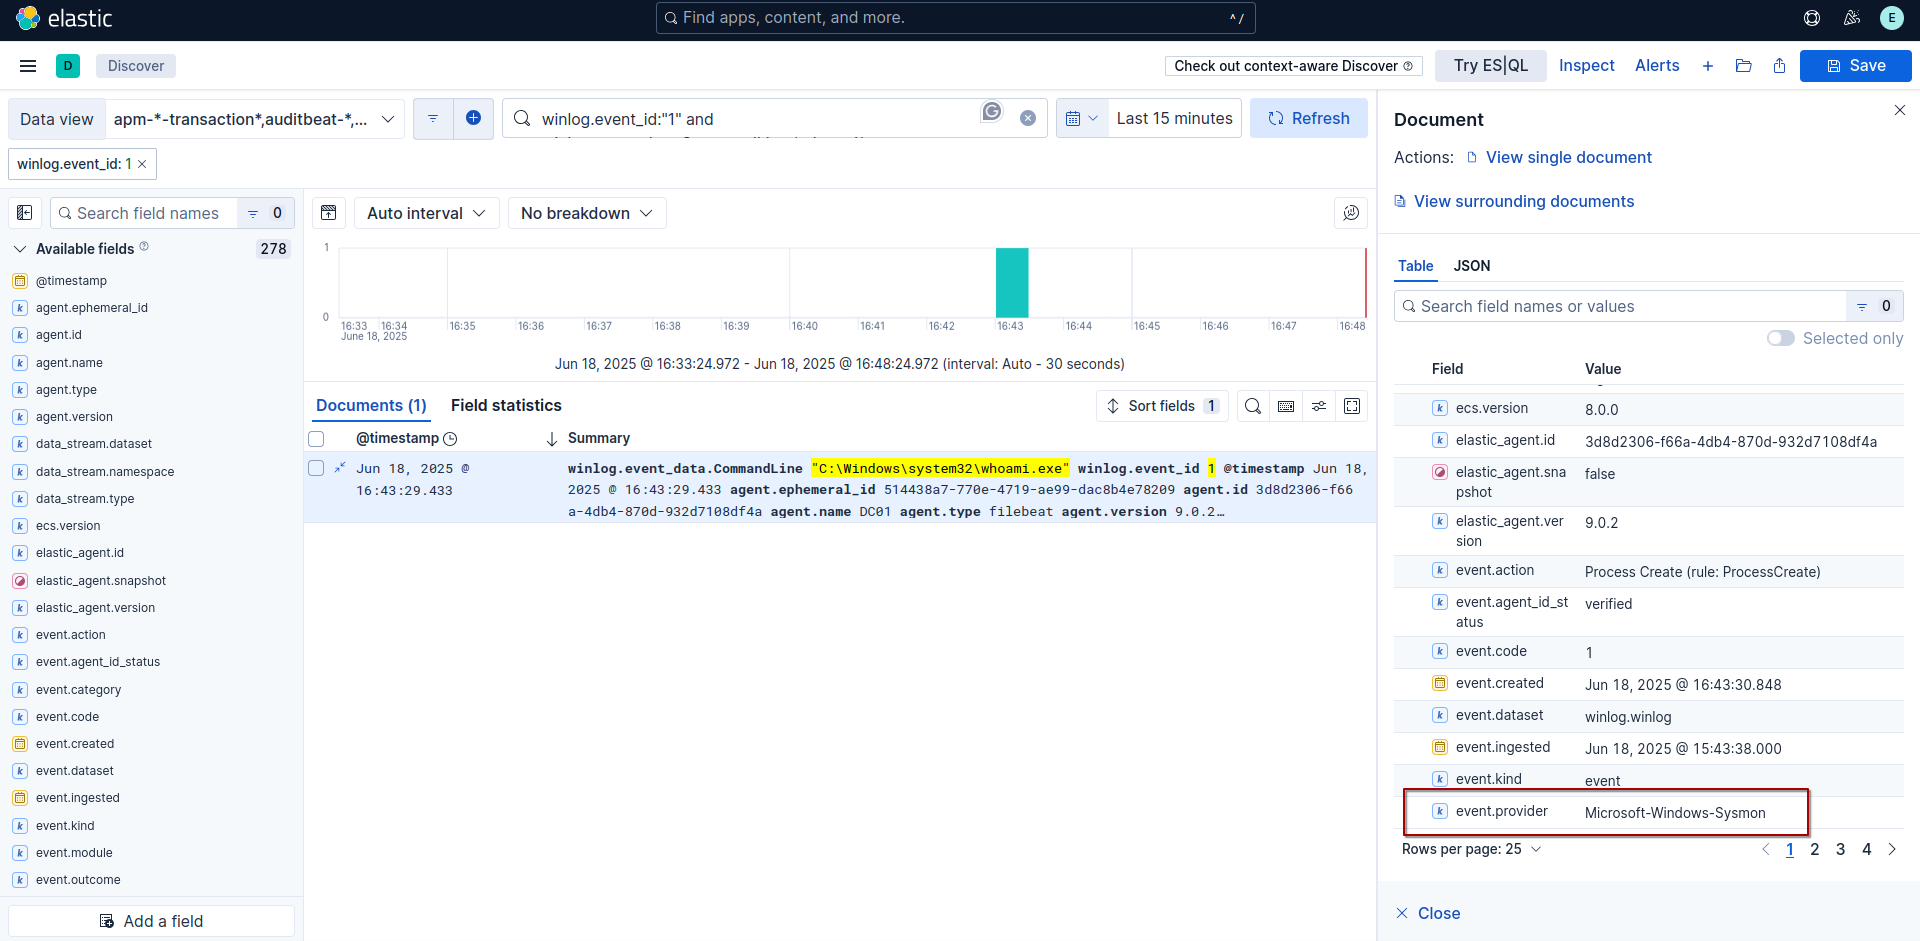
we can confirm that this log came from sysmon by viewing event.provider
Windows Defender
let run simple test by disabling windows defender.
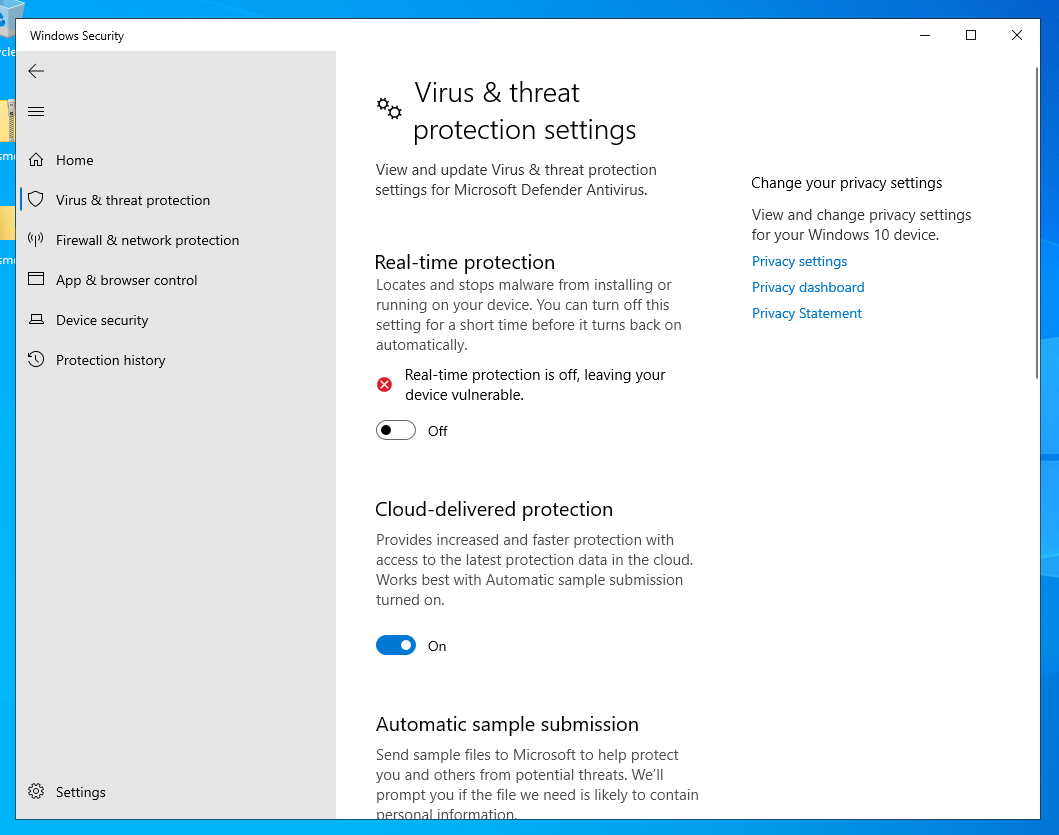
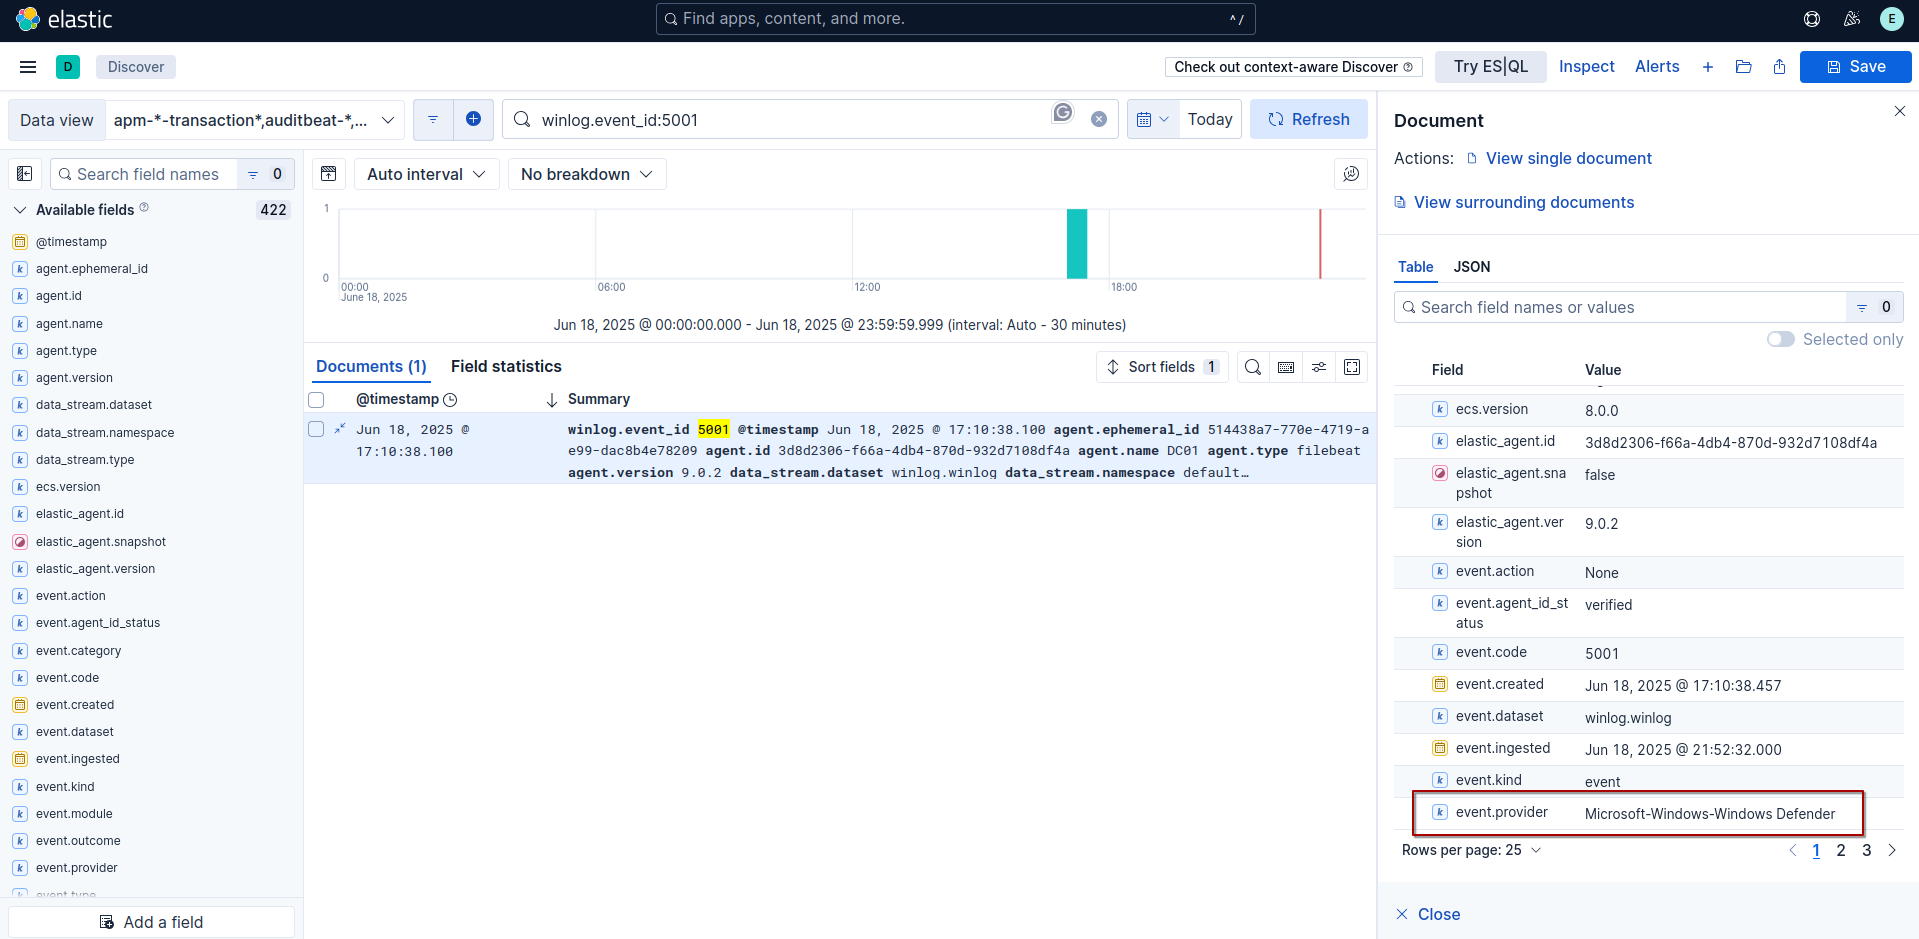
now lets query for event id 5001 with winlog.event_id:5001

and we can check where this logs came from